Palestinian vs Immigrants from Spain 11th Grade
COMPARE
Palestinian
Immigrants from Spain
11th Grade
11th Grade Comparison
Palestinians
Immigrants from Spain
93.4%
11TH GRADE
97.7/ 100
METRIC RATING
115th/ 347
METRIC RANK
92.7%
11TH GRADE
73.0/ 100
METRIC RATING
156th/ 347
METRIC RANK
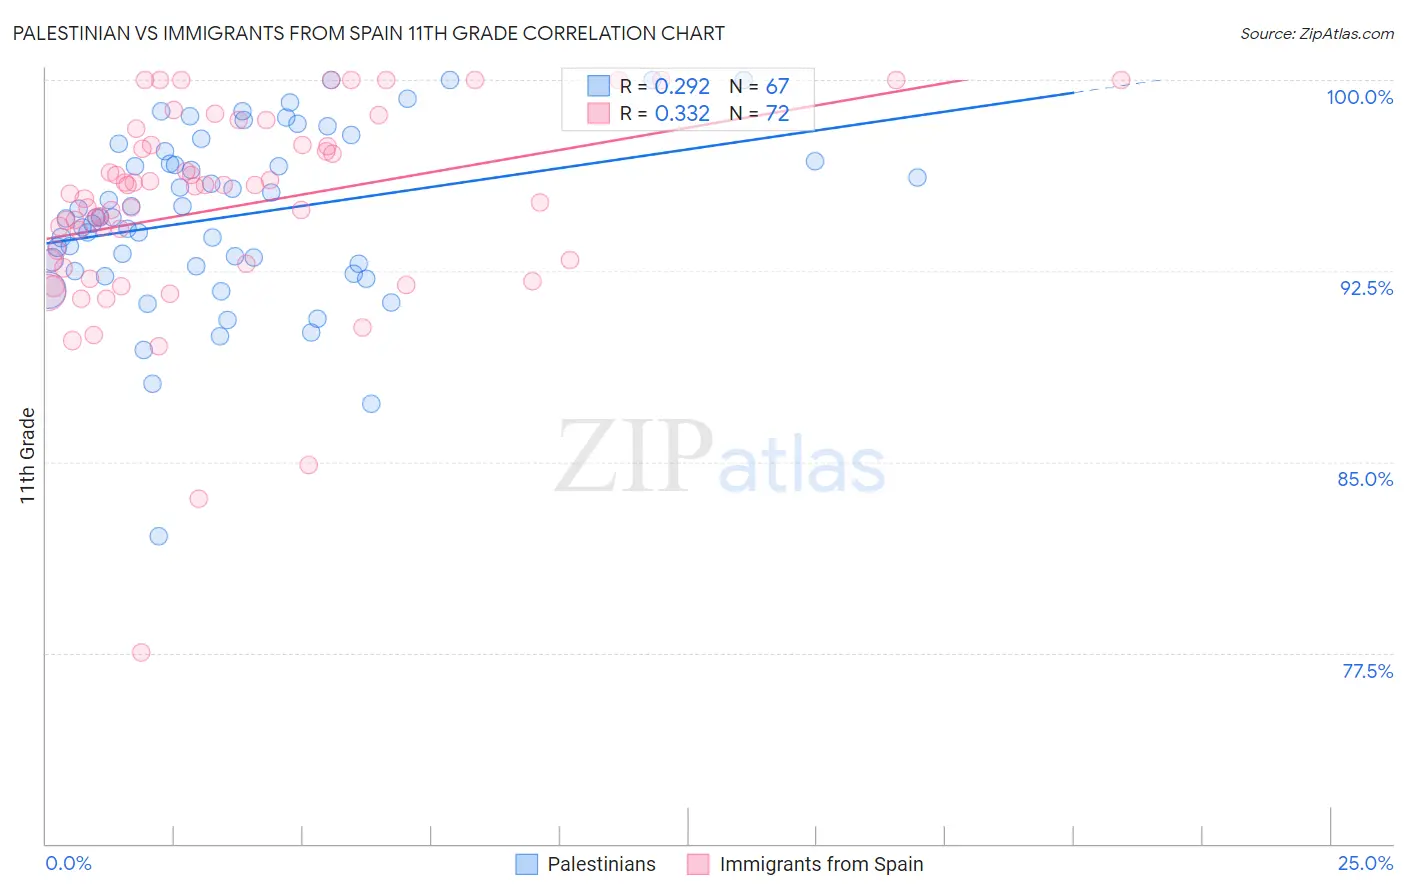
Palestinian vs Immigrants from Spain 11th Grade Correlation Chart
The statistical analysis conducted on geographies consisting of 216,461,770 people shows a weak positive correlation between the proportion of Palestinians and percentage of population with at least 11th grade education in the United States with a correlation coefficient (R) of 0.292 and weighted average of 93.4%. Similarly, the statistical analysis conducted on geographies consisting of 239,682,725 people shows a mild positive correlation between the proportion of Immigrants from Spain and percentage of population with at least 11th grade education in the United States with a correlation coefficient (R) of 0.332 and weighted average of 92.7%, a difference of 0.67%.
11th Grade Correlation Summary
| Measurement | Palestinian | Immigrants from Spain |
| Minimum | 82.1% | 77.5% |
| Maximum | 100.0% | 100.0% |
| Range | 17.9% | 22.5% |
| Mean | 94.7% | 95.0% |
| Median | 94.6% | 95.7% |
| Interquartile 25% (IQ1) | 92.7% | 92.8% |
| Interquartile 75% (IQ3) | 97.2% | 97.4% |
| Interquartile Range (IQR) | 4.5% | 4.6% |
| Standard Deviation (Sample) | 3.4% | 4.0% |
| Standard Deviation (Population) | 3.4% | 4.0% |
Similar Demographics by 11th Grade
Demographics Similar to Palestinians by 11th Grade
In terms of 11th grade, the demographic groups most similar to Palestinians are Jordanian (93.4%, a difference of 0.010%), Immigrants from Zimbabwe (93.4%, a difference of 0.020%), Immigrants from Hungary (93.4%, a difference of 0.020%), White/Caucasian (93.3%, a difference of 0.030%), and Immigrants from Germany (93.4%, a difference of 0.040%).
| Demographics | Rating | Rank | 11th Grade |
| Alaska Natives | 98.4 /100 | #108 | Exceptional 93.5% |
| Immigrants | Kuwait | 98.4 /100 | #109 | Exceptional 93.5% |
| Syrians | 98.4 /100 | #110 | Exceptional 93.4% |
| Yugoslavians | 98.1 /100 | #111 | Exceptional 93.4% |
| Immigrants | Germany | 98.0 /100 | #112 | Exceptional 93.4% |
| Immigrants | Zimbabwe | 97.8 /100 | #113 | Exceptional 93.4% |
| Jordanians | 97.8 /100 | #114 | Exceptional 93.4% |
| Palestinians | 97.7 /100 | #115 | Exceptional 93.4% |
| Immigrants | Hungary | 97.5 /100 | #116 | Exceptional 93.4% |
| Whites/Caucasians | 97.4 /100 | #117 | Exceptional 93.3% |
| Immigrants | Korea | 97.0 /100 | #118 | Exceptional 93.3% |
| Israelis | 97.0 /100 | #119 | Exceptional 93.3% |
| Immigrants | Russia | 96.6 /100 | #120 | Exceptional 93.3% |
| German Russians | 96.4 /100 | #121 | Exceptional 93.3% |
| Immigrants | Belarus | 96.3 /100 | #122 | Exceptional 93.3% |
Demographics Similar to Immigrants from Spain by 11th Grade
In terms of 11th grade, the demographic groups most similar to Immigrants from Spain are Osage (92.7%, a difference of 0.0%), Argentinean (92.7%, a difference of 0.0%), Immigrants from Eastern Asia (92.7%, a difference of 0.0%), Brazilian (92.8%, a difference of 0.010%), and Immigrants from Venezuela (92.7%, a difference of 0.010%).
| Demographics | Rating | Rank | 11th Grade |
| Immigrants | Poland | 78.5 /100 | #149 | Good 92.8% |
| Immigrants | Egypt | 77.5 /100 | #150 | Good 92.8% |
| Potawatomi | 74.3 /100 | #151 | Good 92.8% |
| Iraqis | 74.2 /100 | #152 | Good 92.8% |
| Brazilians | 73.9 /100 | #153 | Good 92.8% |
| Osage | 73.4 /100 | #154 | Good 92.7% |
| Argentineans | 73.4 /100 | #155 | Good 92.7% |
| Immigrants | Spain | 73.0 /100 | #156 | Good 92.7% |
| Immigrants | Eastern Asia | 72.6 /100 | #157 | Good 92.7% |
| Immigrants | Venezuela | 72.0 /100 | #158 | Good 92.7% |
| Americans | 71.7 /100 | #159 | Good 92.7% |
| Immigrants | Lebanon | 70.7 /100 | #160 | Good 92.7% |
| Immigrants | Argentina | 69.8 /100 | #161 | Good 92.7% |
| Paraguayans | 68.7 /100 | #162 | Good 92.7% |
| Immigrants | Nonimmigrants | 66.6 /100 | #163 | Good 92.7% |