Immigrants from North Macedonia vs Immigrants from Moldova 11th Grade
COMPARE
Immigrants from North Macedonia
Immigrants from Moldova
11th Grade
11th Grade Comparison
Immigrants from North Macedonia
Immigrants from Moldova
93.5%
11TH GRADE
98.7/ 100
METRIC RATING
100th/ 347
METRIC RANK
93.7%
11TH GRADE
99.5/ 100
METRIC RATING
81st/ 347
METRIC RANK
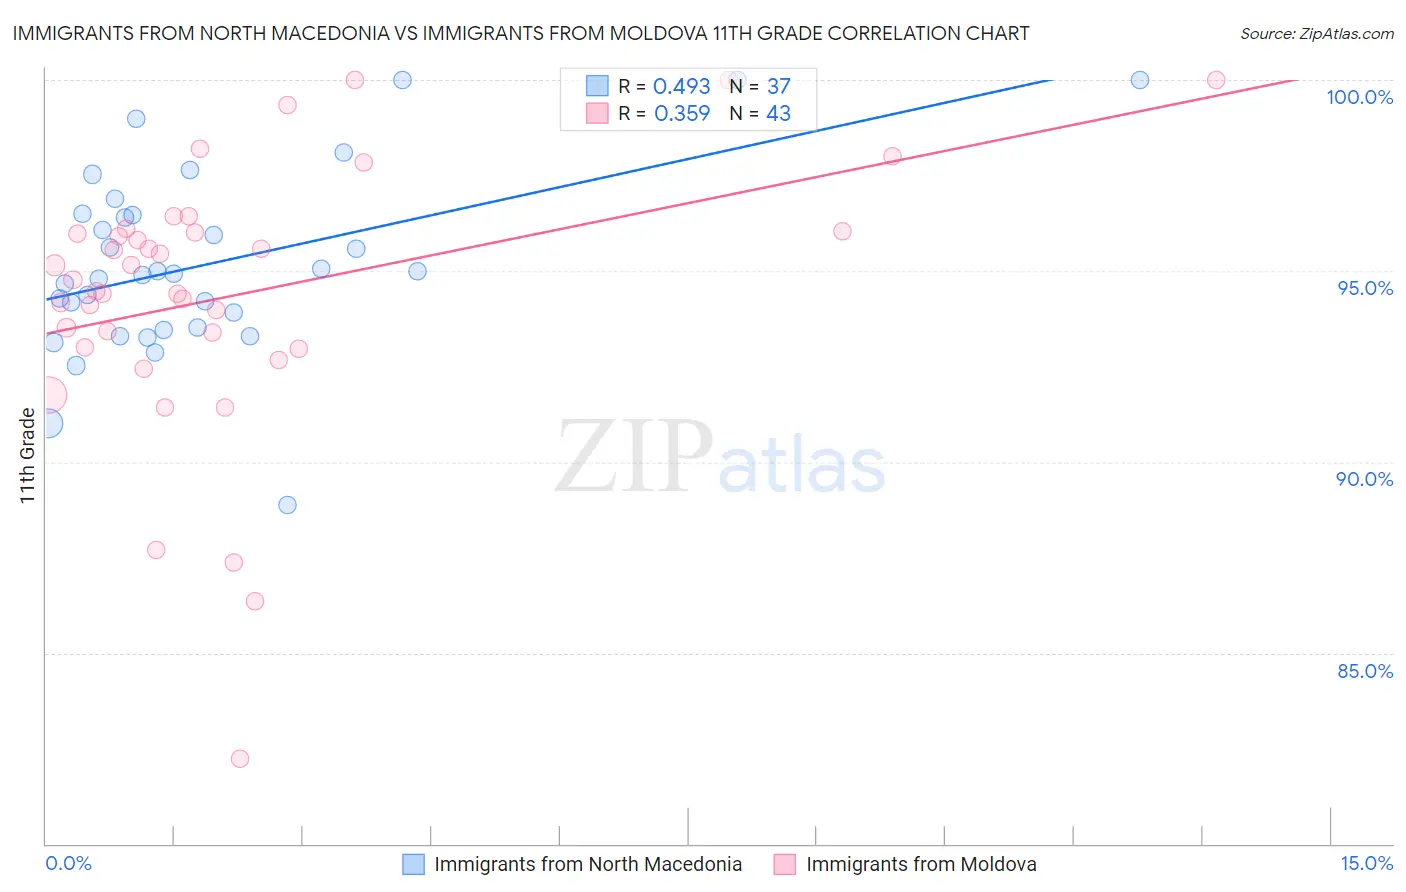
Immigrants from North Macedonia vs Immigrants from Moldova 11th Grade Correlation Chart
The statistical analysis conducted on geographies consisting of 74,300,344 people shows a moderate positive correlation between the proportion of Immigrants from North Macedonia and percentage of population with at least 11th grade education in the United States with a correlation coefficient (R) of 0.493 and weighted average of 93.5%. Similarly, the statistical analysis conducted on geographies consisting of 124,399,411 people shows a mild positive correlation between the proportion of Immigrants from Moldova and percentage of population with at least 11th grade education in the United States with a correlation coefficient (R) of 0.359 and weighted average of 93.7%, a difference of 0.22%.
11th Grade Correlation Summary
| Measurement | Immigrants from North Macedonia | Immigrants from Moldova |
| Minimum | 88.9% | 82.2% |
| Maximum | 100.0% | 100.0% |
| Range | 11.1% | 17.8% |
| Mean | 95.2% | 94.4% |
| Median | 94.9% | 94.8% |
| Interquartile 25% (IQ1) | 93.5% | 93.0% |
| Interquartile 75% (IQ3) | 96.5% | 96.0% |
| Interquartile Range (IQR) | 3.0% | 3.0% |
| Standard Deviation (Sample) | 2.4% | 3.6% |
| Standard Deviation (Population) | 2.4% | 3.5% |
Demographics Similar to Immigrants from North Macedonia and Immigrants from Moldova by 11th Grade
In terms of 11th grade, the demographic groups most similar to Immigrants from North Macedonia are Immigrants from Israel (93.5%, a difference of 0.010%), Menominee (93.5%, a difference of 0.010%), Immigrants from Iran (93.5%, a difference of 0.030%), Immigrants from Turkey (93.5%, a difference of 0.040%), and Swiss (93.6%, a difference of 0.060%). Similarly, the demographic groups most similar to Immigrants from Moldova are Canadian (93.7%, a difference of 0.0%), Immigrants from Saudi Arabia (93.7%, a difference of 0.060%), Icelander (93.6%, a difference of 0.080%), Immigrants from Taiwan (93.6%, a difference of 0.080%), and Immigrants from Switzerland (93.6%, a difference of 0.080%).
| Demographics | Rating | Rank | 11th Grade |
| Canadians | 99.5 /100 | #80 | Exceptional 93.7% |
| Immigrants | Moldova | 99.5 /100 | #81 | Exceptional 93.7% |
| Immigrants | Saudi Arabia | 99.3 /100 | #82 | Exceptional 93.7% |
| Icelanders | 99.3 /100 | #83 | Exceptional 93.6% |
| Immigrants | Taiwan | 99.3 /100 | #84 | Exceptional 93.6% |
| Immigrants | Switzerland | 99.3 /100 | #85 | Exceptional 93.6% |
| Immigrants | South Central Asia | 99.2 /100 | #86 | Exceptional 93.6% |
| Immigrants | Western Europe | 99.2 /100 | #87 | Exceptional 93.6% |
| Cambodians | 99.2 /100 | #88 | Exceptional 93.6% |
| Burmese | 99.2 /100 | #89 | Exceptional 93.6% |
| Ottawa | 99.2 /100 | #90 | Exceptional 93.6% |
| South Africans | 99.2 /100 | #91 | Exceptional 93.6% |
| Immigrants | Bulgaria | 99.1 /100 | #92 | Exceptional 93.6% |
| Puget Sound Salish | 99.1 /100 | #93 | Exceptional 93.6% |
| Swiss | 99.0 /100 | #94 | Exceptional 93.6% |
| Immigrants | France | 99.0 /100 | #95 | Exceptional 93.6% |
| Immigrants | Turkey | 98.9 /100 | #96 | Exceptional 93.5% |
| Immigrants | Iran | 98.9 /100 | #97 | Exceptional 93.5% |
| Immigrants | Israel | 98.8 /100 | #98 | Exceptional 93.5% |
| Menominee | 98.7 /100 | #99 | Exceptional 93.5% |
| Immigrants | North Macedonia | 98.7 /100 | #100 | Exceptional 93.5% |