Immigrants from France vs Cypriot Nursery School
COMPARE
Immigrants from France
Cypriot
Nursery School
Nursery School Comparison
Immigrants from France
Cypriots
98.2%
NURSERY SCHOOL
95.6/ 100
METRIC RATING
117th/ 347
METRIC RANK
98.3%
NURSERY SCHOOL
98.3/ 100
METRIC RATING
96th/ 347
METRIC RANK
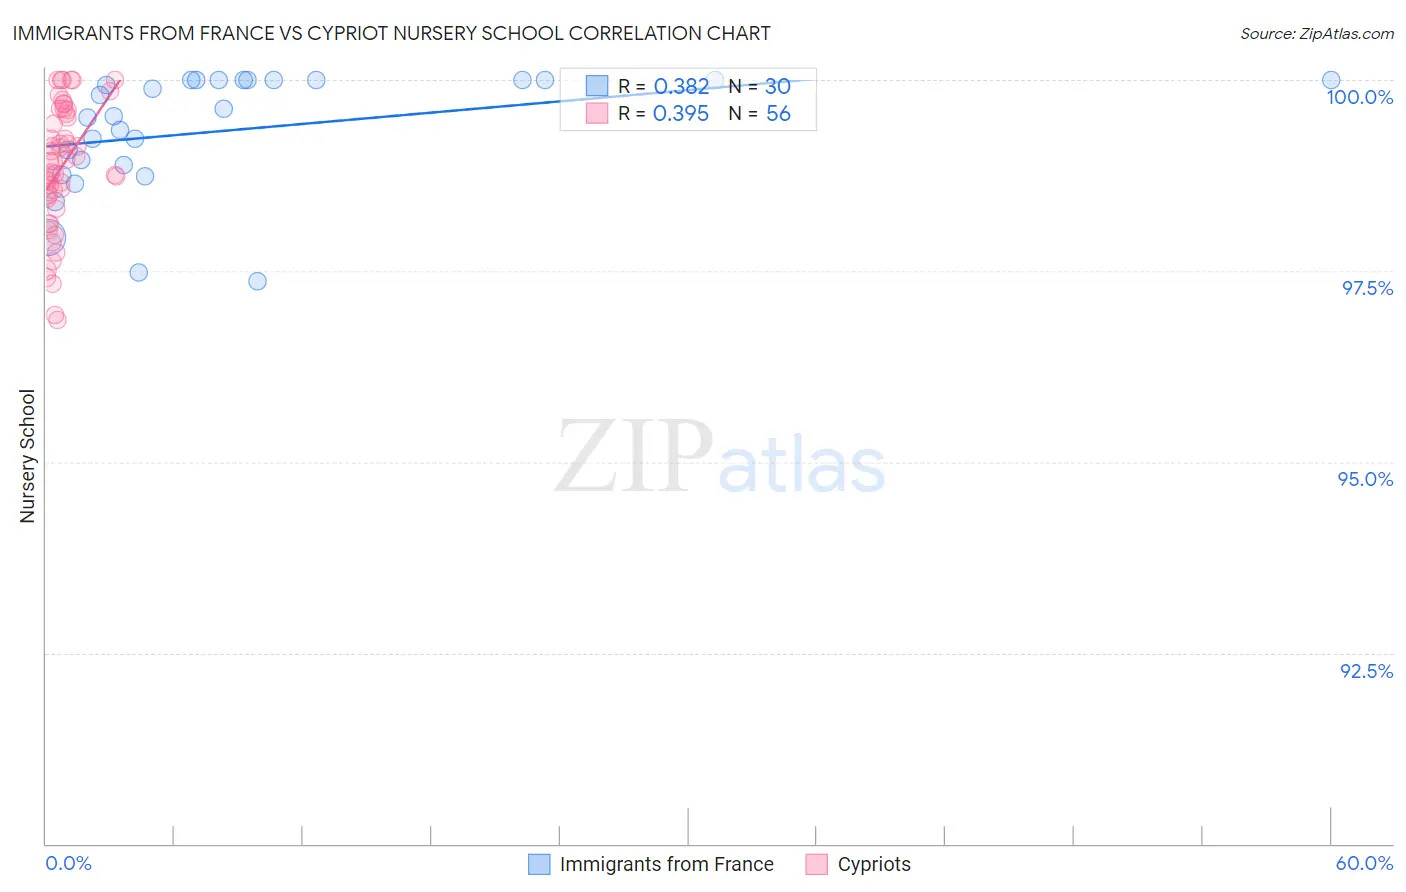
Immigrants from France vs Cypriot Nursery School Correlation Chart
The statistical analysis conducted on geographies consisting of 287,920,814 people shows a mild positive correlation between the proportion of Immigrants from France and percentage of population with at least nursery school education in the United States with a correlation coefficient (R) of 0.382 and weighted average of 98.2%. Similarly, the statistical analysis conducted on geographies consisting of 61,867,249 people shows a mild positive correlation between the proportion of Cypriots and percentage of population with at least nursery school education in the United States with a correlation coefficient (R) of 0.395 and weighted average of 98.3%, a difference of 0.080%.
Nursery School Correlation Summary
| Measurement | Immigrants from France | Cypriot |
| Minimum | 97.4% | 96.9% |
| Maximum | 100.0% | 100.0% |
| Range | 2.6% | 3.1% |
| Mean | 99.3% | 98.9% |
| Median | 99.6% | 98.9% |
| Interquartile 25% (IQ1) | 98.9% | 98.5% |
| Interquartile 75% (IQ3) | 100.0% | 99.6% |
| Interquartile Range (IQR) | 1.1% | 1.1% |
| Standard Deviation (Sample) | 0.78% | 0.82% |
| Standard Deviation (Population) | 0.77% | 0.81% |
Similar Demographics by Nursery School
Demographics Similar to Immigrants from France by Nursery School
In terms of nursery school, the demographic groups most similar to Immigrants from France are Spanish (98.2%, a difference of 0.0%), Yugoslavian (98.2%, a difference of 0.0%), Ute (98.2%, a difference of 0.010%), Iranian (98.2%, a difference of 0.010%), and Thai (98.2%, a difference of 0.010%).
| Demographics | Rating | Rank | Nursery School |
| Immigrants | Singapore | 96.9 /100 | #110 | Exceptional 98.2% |
| Immigrants | Czechoslovakia | 96.8 /100 | #111 | Exceptional 98.2% |
| Immigrants | Norway | 96.6 /100 | #112 | Exceptional 98.2% |
| Immigrants | Latvia | 96.4 /100 | #113 | Exceptional 98.2% |
| Ute | 96.4 /100 | #114 | Exceptional 98.2% |
| Iranians | 96.3 /100 | #115 | Exceptional 98.2% |
| Spanish | 95.8 /100 | #116 | Exceptional 98.2% |
| Immigrants | France | 95.6 /100 | #117 | Exceptional 98.2% |
| Yugoslavians | 95.4 /100 | #118 | Exceptional 98.2% |
| Thais | 95.0 /100 | #119 | Exceptional 98.2% |
| Okinawans | 94.5 /100 | #120 | Exceptional 98.2% |
| Immigrants | Zimbabwe | 94.2 /100 | #121 | Exceptional 98.2% |
| Immigrants | Japan | 94.0 /100 | #122 | Exceptional 98.2% |
| Syrians | 93.9 /100 | #123 | Exceptional 98.2% |
| Lebanese | 93.8 /100 | #124 | Exceptional 98.2% |
Demographics Similar to Cypriots by Nursery School
In terms of nursery school, the demographic groups most similar to Cypriots are Nonimmigrants (98.3%, a difference of 0.0%), Choctaw (98.3%, a difference of 0.0%), Immigrants from Germany (98.3%, a difference of 0.010%), South African (98.3%, a difference of 0.010%), and Colville (98.3%, a difference of 0.010%).
| Demographics | Rating | Rank | Nursery School |
| Immigrants | South Africa | 98.8 /100 | #89 | Exceptional 98.3% |
| Immigrants | Western Europe | 98.8 /100 | #90 | Exceptional 98.3% |
| Zimbabweans | 98.8 /100 | #91 | Exceptional 98.3% |
| Macedonians | 98.7 /100 | #92 | Exceptional 98.3% |
| Immigrants | India | 98.7 /100 | #93 | Exceptional 98.3% |
| Immigrants | Germany | 98.6 /100 | #94 | Exceptional 98.3% |
| South Africans | 98.6 /100 | #95 | Exceptional 98.3% |
| Cypriots | 98.3 /100 | #96 | Exceptional 98.3% |
| Immigrants | Nonimmigrants | 98.3 /100 | #97 | Exceptional 98.3% |
| Choctaw | 98.3 /100 | #98 | Exceptional 98.3% |
| Colville | 98.2 /100 | #99 | Exceptional 98.3% |
| Puget Sound Salish | 98.0 /100 | #100 | Exceptional 98.3% |
| Romanians | 97.9 /100 | #101 | Exceptional 98.3% |
| Immigrants | Ireland | 97.7 /100 | #102 | Exceptional 98.3% |
| Cree | 97.7 /100 | #103 | Exceptional 98.3% |