Immigrants from Fiji vs Liberian No Schooling Completed
COMPARE
Immigrants from Fiji
Liberian
No Schooling Completed
No Schooling Completed Comparison
Immigrants from Fiji
Liberians
3.5%
NO SCHOOLING COMPLETED
0.0/ 100
METRIC RATING
336th/ 347
METRIC RANK
2.4%
NO SCHOOLING COMPLETED
1.8/ 100
METRIC RATING
239th/ 347
METRIC RANK
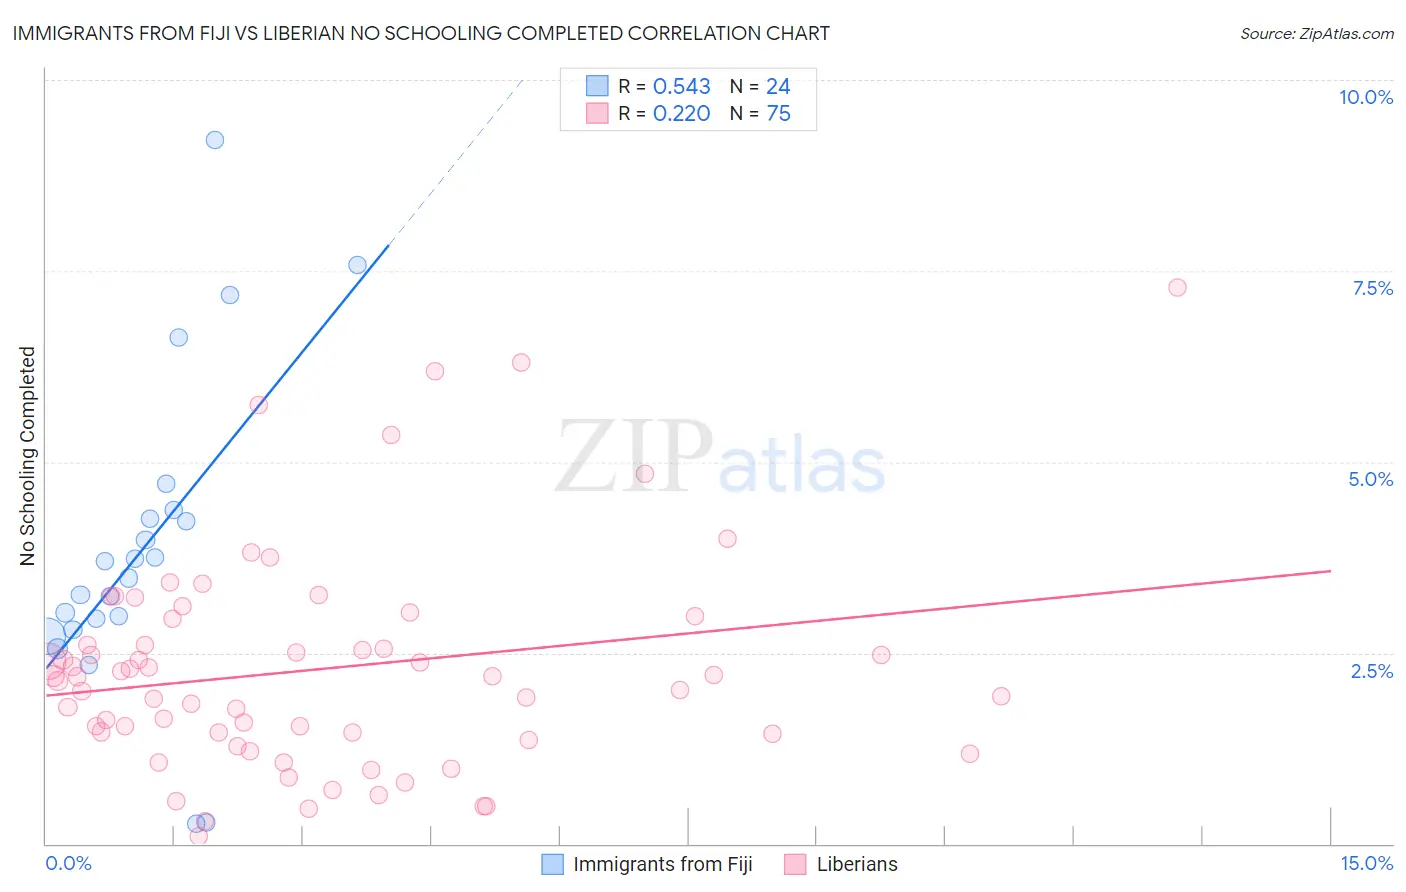
Immigrants from Fiji vs Liberian No Schooling Completed Correlation Chart
The statistical analysis conducted on geographies consisting of 93,588,914 people shows a substantial positive correlation between the proportion of Immigrants from Fiji and percentage of population with no schooling in the United States with a correlation coefficient (R) of 0.543 and weighted average of 3.5%. Similarly, the statistical analysis conducted on geographies consisting of 117,885,030 people shows a weak positive correlation between the proportion of Liberians and percentage of population with no schooling in the United States with a correlation coefficient (R) of 0.220 and weighted average of 2.4%, a difference of 48.0%.
No Schooling Completed Correlation Summary
| Measurement | Immigrants from Fiji | Liberian |
| Minimum | 0.26% | 0.10% |
| Maximum | 9.2% | 7.3% |
| Range | 9.0% | 7.2% |
| Mean | 3.9% | 2.3% |
| Median | 3.6% | 2.2% |
| Interquartile 25% (IQ1) | 2.9% | 1.4% |
| Interquartile 75% (IQ3) | 4.3% | 3.0% |
| Interquartile Range (IQR) | 1.4% | 1.5% |
| Standard Deviation (Sample) | 2.1% | 1.4% |
| Standard Deviation (Population) | 2.0% | 1.4% |
Similar Demographics by No Schooling Completed
Demographics Similar to Immigrants from Fiji by No Schooling Completed
In terms of no schooling completed, the demographic groups most similar to Immigrants from Fiji are Immigrants from Cambodia (3.5%, a difference of 0.37%), Immigrants from Cabo Verde (3.5%, a difference of 0.71%), Bangladeshi (3.5%, a difference of 0.95%), Yakama (3.6%, a difference of 1.3%), and Guatemalan (3.5%, a difference of 1.4%).
| Demographics | Rating | Rank | No Schooling Completed |
| Immigrants | Vietnam | 0.0 /100 | #329 | Tragic 3.3% |
| Immigrants | Armenia | 0.0 /100 | #330 | Tragic 3.3% |
| Japanese | 0.0 /100 | #331 | Tragic 3.3% |
| Central Americans | 0.0 /100 | #332 | Tragic 3.4% |
| Immigrants | Dominican Republic | 0.0 /100 | #333 | Tragic 3.4% |
| Guatemalans | 0.0 /100 | #334 | Tragic 3.5% |
| Immigrants | Cambodia | 0.0 /100 | #335 | Tragic 3.5% |
| Immigrants | Fiji | 0.0 /100 | #336 | Tragic 3.5% |
| Immigrants | Cabo Verde | 0.0 /100 | #337 | Tragic 3.5% |
| Bangladeshis | 0.0 /100 | #338 | Tragic 3.5% |
| Yakama | 0.0 /100 | #339 | Tragic 3.6% |
| Immigrants | Guatemala | 0.0 /100 | #340 | Tragic 3.6% |
| Immigrants | Central America | 0.0 /100 | #341 | Tragic 3.6% |
| Immigrants | Mexico | 0.0 /100 | #342 | Tragic 3.6% |
| Salvadorans | 0.0 /100 | #343 | Tragic 3.7% |
Demographics Similar to Liberians by No Schooling Completed
In terms of no schooling completed, the demographic groups most similar to Liberians are Paiute (2.4%, a difference of 0.12%), Immigrants from Senegal (2.4%, a difference of 0.23%), Korean (2.4%, a difference of 0.29%), Immigrants from Eastern Asia (2.4%, a difference of 0.33%), and Iraqi (2.4%, a difference of 0.53%).
| Demographics | Rating | Rank | No Schooling Completed |
| Colombians | 3.2 /100 | #232 | Tragic 2.3% |
| Immigrants | Malaysia | 2.8 /100 | #233 | Tragic 2.3% |
| Nigerians | 2.6 /100 | #234 | Tragic 2.3% |
| Immigrants | Western Asia | 2.6 /100 | #235 | Tragic 2.3% |
| Iraqis | 2.2 /100 | #236 | Tragic 2.4% |
| Immigrants | Eastern Asia | 2.0 /100 | #237 | Tragic 2.4% |
| Paiute | 1.9 /100 | #238 | Tragic 2.4% |
| Liberians | 1.8 /100 | #239 | Tragic 2.4% |
| Immigrants | Senegal | 1.7 /100 | #240 | Tragic 2.4% |
| Koreans | 1.7 /100 | #241 | Tragic 2.4% |
| Immigrants | Indonesia | 1.5 /100 | #242 | Tragic 2.4% |
| South Americans | 1.5 /100 | #243 | Tragic 2.4% |
| Peruvians | 1.4 /100 | #244 | Tragic 2.4% |
| Bolivians | 1.4 /100 | #245 | Tragic 2.4% |
| Immigrants | Congo | 1.4 /100 | #246 | Tragic 2.4% |