Immigrants from Ethiopia vs Dutch West Indian College, Under 1 year
COMPARE
Immigrants from Ethiopia
Dutch West Indian
College, Under 1 year
College, Under 1 year Comparison
Immigrants from Ethiopia
Dutch West Indians
68.0%
COLLEGE, UNDER 1 YEAR
97.3/ 100
METRIC RATING
97th/ 347
METRIC RANK
57.2%
COLLEGE, UNDER 1 YEAR
0.0/ 100
METRIC RATING
313th/ 347
METRIC RANK
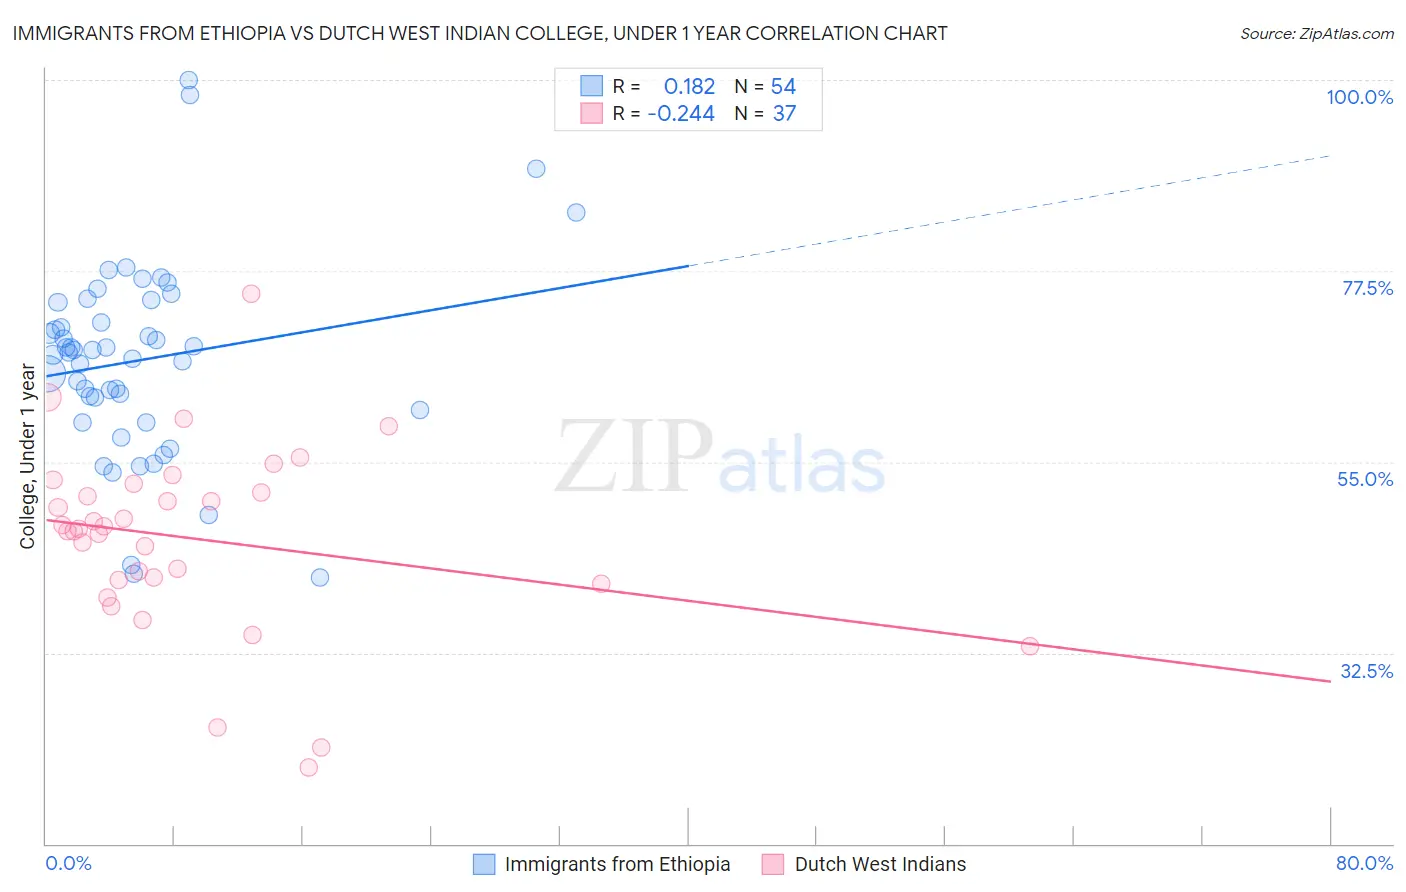
Immigrants from Ethiopia vs Dutch West Indian College, Under 1 year Correlation Chart
The statistical analysis conducted on geographies consisting of 211,551,932 people shows a poor positive correlation between the proportion of Immigrants from Ethiopia and percentage of population with at least college, under 1 year education in the United States with a correlation coefficient (R) of 0.182 and weighted average of 68.0%. Similarly, the statistical analysis conducted on geographies consisting of 85,776,067 people shows a weak negative correlation between the proportion of Dutch West Indians and percentage of population with at least college, under 1 year education in the United States with a correlation coefficient (R) of -0.244 and weighted average of 57.2%, a difference of 19.0%.
College, Under 1 year Correlation Summary
| Measurement | Immigrants from Ethiopia | Dutch West Indian |
| Minimum | 41.4% | 19.0% |
| Maximum | 100.0% | 74.8% |
| Range | 58.6% | 55.8% |
| Mean | 67.0% | 45.9% |
| Median | 68.0% | 47.1% |
| Interquartile 25% (IQ1) | 61.1% | 40.9% |
| Interquartile 75% (IQ3) | 73.8% | 51.9% |
| Interquartile Range (IQR) | 12.6% | 11.1% |
| Standard Deviation (Sample) | 11.6% | 11.0% |
| Standard Deviation (Population) | 11.5% | 10.8% |
Similar Demographics by College, Under 1 year
Demographics Similar to Immigrants from Ethiopia by College, Under 1 year
In terms of college, under 1 year, the demographic groups most similar to Immigrants from Ethiopia are Jordanian (68.0%, a difference of 0.030%), Immigrants from Pakistan (68.0%, a difference of 0.060%), Paraguayan (67.9%, a difference of 0.10%), Immigrants from Bolivia (67.9%, a difference of 0.12%), and Immigrants from Argentina (67.9%, a difference of 0.13%).
| Demographics | Rating | Rank | College, Under 1 year |
| Icelanders | 98.1 /100 | #90 | Exceptional 68.3% |
| Europeans | 98.1 /100 | #91 | Exceptional 68.2% |
| Luxembourgers | 98.1 /100 | #92 | Exceptional 68.2% |
| Romanians | 97.9 /100 | #93 | Exceptional 68.2% |
| Armenians | 97.7 /100 | #94 | Exceptional 68.1% |
| Immigrants | Pakistan | 97.5 /100 | #95 | Exceptional 68.0% |
| Jordanians | 97.4 /100 | #96 | Exceptional 68.0% |
| Immigrants | Ethiopia | 97.3 /100 | #97 | Exceptional 68.0% |
| Paraguayans | 97.1 /100 | #98 | Exceptional 67.9% |
| Immigrants | Bolivia | 97.0 /100 | #99 | Exceptional 67.9% |
| Immigrants | Argentina | 97.0 /100 | #100 | Exceptional 67.9% |
| Immigrants | Eastern Europe | 96.9 /100 | #101 | Exceptional 67.9% |
| Palestinians | 96.9 /100 | #102 | Exceptional 67.9% |
| Carpatho Rusyns | 96.8 /100 | #103 | Exceptional 67.9% |
| Immigrants | Western Asia | 96.6 /100 | #104 | Exceptional 67.8% |
Demographics Similar to Dutch West Indians by College, Under 1 year
In terms of college, under 1 year, the demographic groups most similar to Dutch West Indians are Hopi (57.1%, a difference of 0.12%), Honduran (57.1%, a difference of 0.16%), Menominee (57.0%, a difference of 0.22%), Salvadoran (57.3%, a difference of 0.24%), and Hispanic or Latino (57.0%, a difference of 0.26%).
| Demographics | Rating | Rank | College, Under 1 year |
| Immigrants | Portugal | 0.0 /100 | #306 | Tragic 57.7% |
| Fijians | 0.0 /100 | #307 | Tragic 57.7% |
| Central Americans | 0.0 /100 | #308 | Tragic 57.7% |
| Immigrants | Nicaragua | 0.0 /100 | #309 | Tragic 57.6% |
| Pueblo | 0.0 /100 | #310 | Tragic 57.4% |
| Cajuns | 0.0 /100 | #311 | Tragic 57.3% |
| Salvadorans | 0.0 /100 | #312 | Tragic 57.3% |
| Dutch West Indians | 0.0 /100 | #313 | Tragic 57.2% |
| Hopi | 0.0 /100 | #314 | Tragic 57.1% |
| Hondurans | 0.0 /100 | #315 | Tragic 57.1% |
| Menominee | 0.0 /100 | #316 | Tragic 57.0% |
| Hispanics or Latinos | 0.0 /100 | #317 | Tragic 57.0% |
| Immigrants | Haiti | 0.0 /100 | #318 | Tragic 56.9% |
| Puerto Ricans | 0.0 /100 | #319 | Tragic 56.8% |
| Guatemalans | 0.0 /100 | #320 | Tragic 56.8% |