Immigrants from Ethiopia vs Colombian College, Under 1 year
COMPARE
Immigrants from Ethiopia
Colombian
College, Under 1 year
College, Under 1 year Comparison
Immigrants from Ethiopia
Colombians
68.0%
COLLEGE, UNDER 1 YEAR
97.3/ 100
METRIC RATING
97th/ 347
METRIC RANK
64.0%
COLLEGE, UNDER 1 YEAR
12.4/ 100
METRIC RATING
207th/ 347
METRIC RANK
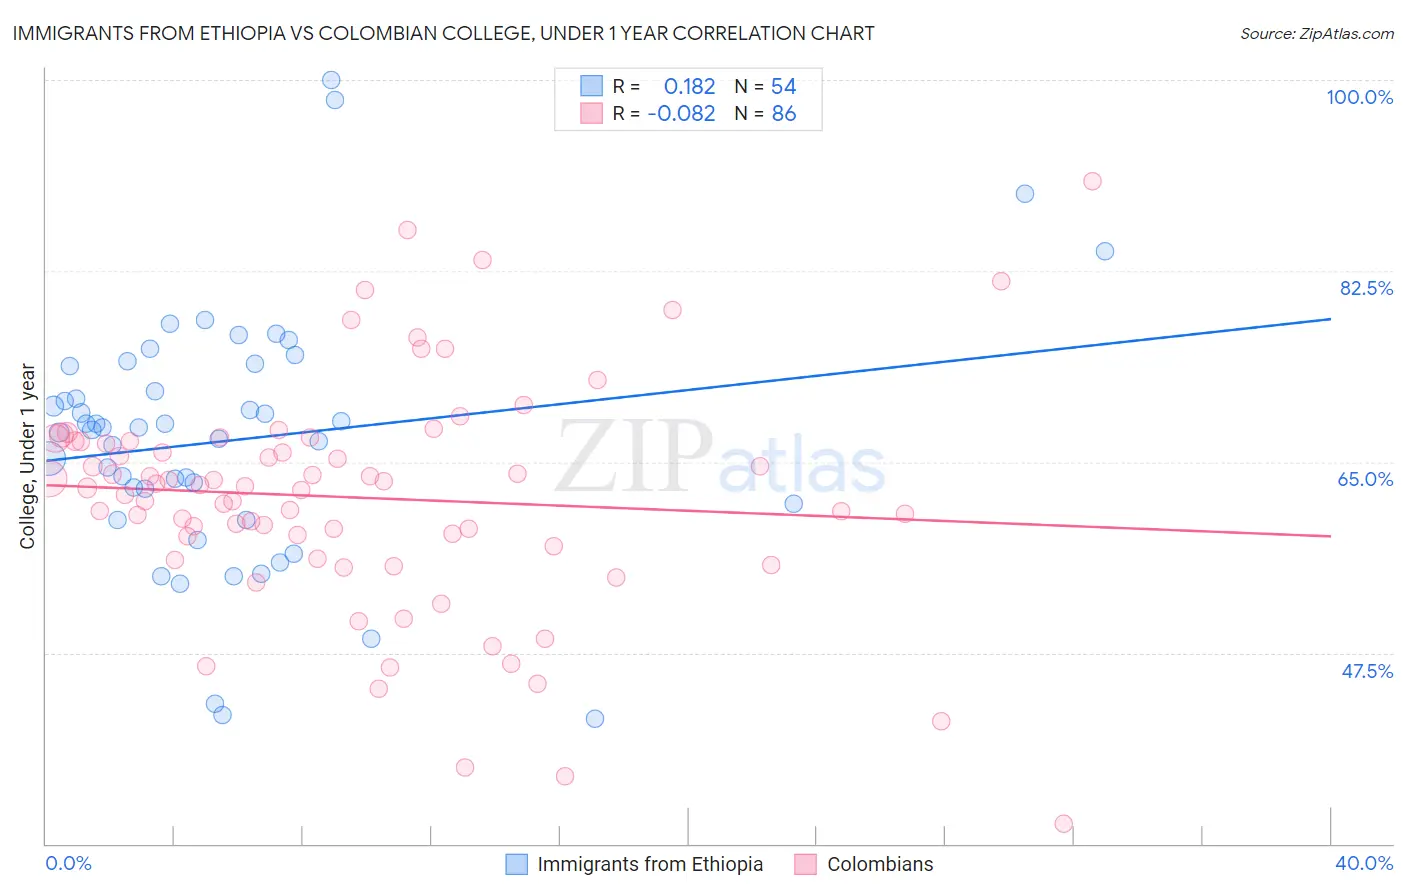
Immigrants from Ethiopia vs Colombian College, Under 1 year Correlation Chart
The statistical analysis conducted on geographies consisting of 211,551,932 people shows a poor positive correlation between the proportion of Immigrants from Ethiopia and percentage of population with at least college, under 1 year education in the United States with a correlation coefficient (R) of 0.182 and weighted average of 68.0%. Similarly, the statistical analysis conducted on geographies consisting of 419,699,674 people shows a slight negative correlation between the proportion of Colombians and percentage of population with at least college, under 1 year education in the United States with a correlation coefficient (R) of -0.082 and weighted average of 64.0%, a difference of 6.2%.
College, Under 1 year Correlation Summary
| Measurement | Immigrants from Ethiopia | Colombian |
| Minimum | 41.4% | 31.8% |
| Maximum | 100.0% | 90.7% |
| Range | 58.6% | 58.9% |
| Mean | 67.0% | 61.7% |
| Median | 68.0% | 62.7% |
| Interquartile 25% (IQ1) | 61.1% | 57.3% |
| Interquartile 75% (IQ3) | 73.8% | 66.9% |
| Interquartile Range (IQR) | 12.6% | 9.6% |
| Standard Deviation (Sample) | 11.6% | 10.6% |
| Standard Deviation (Population) | 11.5% | 10.5% |
Similar Demographics by College, Under 1 year
Demographics Similar to Immigrants from Ethiopia by College, Under 1 year
In terms of college, under 1 year, the demographic groups most similar to Immigrants from Ethiopia are Jordanian (68.0%, a difference of 0.030%), Immigrants from Pakistan (68.0%, a difference of 0.060%), Paraguayan (67.9%, a difference of 0.10%), Immigrants from Bolivia (67.9%, a difference of 0.12%), and Immigrants from Argentina (67.9%, a difference of 0.13%).
| Demographics | Rating | Rank | College, Under 1 year |
| Icelanders | 98.1 /100 | #90 | Exceptional 68.3% |
| Europeans | 98.1 /100 | #91 | Exceptional 68.2% |
| Luxembourgers | 98.1 /100 | #92 | Exceptional 68.2% |
| Romanians | 97.9 /100 | #93 | Exceptional 68.2% |
| Armenians | 97.7 /100 | #94 | Exceptional 68.1% |
| Immigrants | Pakistan | 97.5 /100 | #95 | Exceptional 68.0% |
| Jordanians | 97.4 /100 | #96 | Exceptional 68.0% |
| Immigrants | Ethiopia | 97.3 /100 | #97 | Exceptional 68.0% |
| Paraguayans | 97.1 /100 | #98 | Exceptional 67.9% |
| Immigrants | Bolivia | 97.0 /100 | #99 | Exceptional 67.9% |
| Immigrants | Argentina | 97.0 /100 | #100 | Exceptional 67.9% |
| Immigrants | Eastern Europe | 96.9 /100 | #101 | Exceptional 67.9% |
| Palestinians | 96.9 /100 | #102 | Exceptional 67.9% |
| Carpatho Rusyns | 96.8 /100 | #103 | Exceptional 67.9% |
| Immigrants | Western Asia | 96.6 /100 | #104 | Exceptional 67.8% |
Demographics Similar to Colombians by College, Under 1 year
In terms of college, under 1 year, the demographic groups most similar to Colombians are Immigrants from Vietnam (64.0%, a difference of 0.030%), White/Caucasian (64.0%, a difference of 0.040%), Puget Sound Salish (63.9%, a difference of 0.12%), Peruvian (64.1%, a difference of 0.13%), and Ghanaian (63.9%, a difference of 0.13%).
| Demographics | Rating | Rank | College, Under 1 year |
| Nigerians | 16.7 /100 | #200 | Poor 64.3% |
| French Canadians | 16.3 /100 | #201 | Poor 64.2% |
| South Americans | 16.2 /100 | #202 | Poor 64.2% |
| Uruguayans | 15.6 /100 | #203 | Poor 64.2% |
| Immigrants | Zaire | 14.6 /100 | #204 | Poor 64.1% |
| Peruvians | 13.7 /100 | #205 | Poor 64.1% |
| Whites/Caucasians | 12.8 /100 | #206 | Poor 64.0% |
| Colombians | 12.4 /100 | #207 | Poor 64.0% |
| Immigrants | Vietnam | 12.1 /100 | #208 | Poor 64.0% |
| Puget Sound Salish | 11.3 /100 | #209 | Poor 63.9% |
| Ghanaians | 11.2 /100 | #210 | Poor 63.9% |
| Native Hawaiians | 10.6 /100 | #211 | Poor 63.9% |
| Immigrants | Middle Africa | 10.5 /100 | #212 | Poor 63.9% |
| Immigrants | South America | 9.1 /100 | #213 | Tragic 63.8% |
| Immigrants | Nigeria | 8.8 /100 | #214 | Tragic 63.7% |