Immigrants from England vs Nicaraguan 10th Grade
COMPARE
Immigrants from England
Nicaraguan
10th Grade
10th Grade Comparison
Immigrants from England
Nicaraguans
94.9%
10TH GRADE
99.6/ 100
METRIC RATING
69th/ 347
METRIC RANK
90.2%
10TH GRADE
0.0/ 100
METRIC RATING
319th/ 347
METRIC RANK
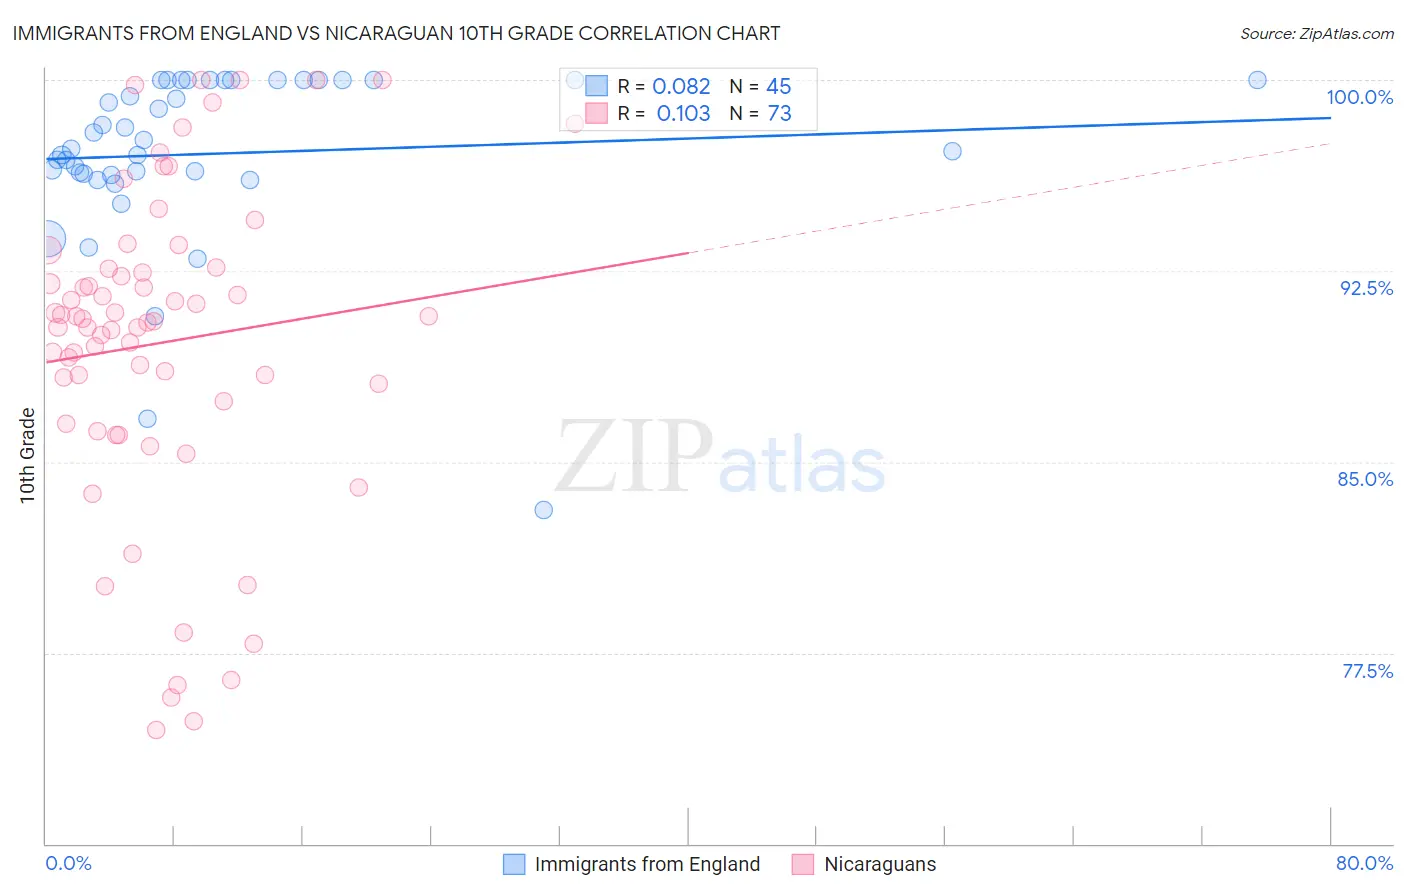
Immigrants from England vs Nicaraguan 10th Grade Correlation Chart
The statistical analysis conducted on geographies consisting of 391,897,374 people shows a slight positive correlation between the proportion of Immigrants from England and percentage of population with at least 10th grade education in the United States with a correlation coefficient (R) of 0.082 and weighted average of 94.9%. Similarly, the statistical analysis conducted on geographies consisting of 285,711,651 people shows a poor positive correlation between the proportion of Nicaraguans and percentage of population with at least 10th grade education in the United States with a correlation coefficient (R) of 0.103 and weighted average of 90.2%, a difference of 5.2%.
10th Grade Correlation Summary
| Measurement | Immigrants from England | Nicaraguan |
| Minimum | 83.1% | 74.5% |
| Maximum | 100.0% | 100.0% |
| Range | 16.9% | 25.5% |
| Mean | 97.1% | 89.7% |
| Median | 97.3% | 90.5% |
| Interquartile 25% (IQ1) | 96.3% | 86.9% |
| Interquartile 75% (IQ3) | 100.0% | 92.6% |
| Interquartile Range (IQR) | 3.7% | 5.7% |
| Standard Deviation (Sample) | 3.5% | 6.3% |
| Standard Deviation (Population) | 3.5% | 6.2% |
Similar Demographics by 10th Grade
Demographics Similar to Immigrants from England by 10th Grade
In terms of 10th grade, the demographic groups most similar to Immigrants from England are Immigrants from Belgium (94.9%, a difference of 0.010%), Zimbabwean (94.9%, a difference of 0.010%), Alaska Native (94.9%, a difference of 0.010%), Immigrants from Australia (94.9%, a difference of 0.020%), and Immigrants from Netherlands (94.9%, a difference of 0.020%).
| Demographics | Rating | Rank | 10th Grade |
| Thais | 99.8 /100 | #62 | Exceptional 95.0% |
| Immigrants | Singapore | 99.8 /100 | #63 | Exceptional 95.0% |
| Native Hawaiians | 99.7 /100 | #64 | Exceptional 95.0% |
| Turks | 99.7 /100 | #65 | Exceptional 95.0% |
| Immigrants | Australia | 99.7 /100 | #66 | Exceptional 94.9% |
| Immigrants | Netherlands | 99.7 /100 | #67 | Exceptional 94.9% |
| Immigrants | Belgium | 99.7 /100 | #68 | Exceptional 94.9% |
| Immigrants | England | 99.6 /100 | #69 | Exceptional 94.9% |
| Zimbabweans | 99.6 /100 | #70 | Exceptional 94.9% |
| Alaska Natives | 99.6 /100 | #71 | Exceptional 94.9% |
| Immigrants | Sweden | 99.6 /100 | #72 | Exceptional 94.9% |
| Bhutanese | 99.6 /100 | #73 | Exceptional 94.9% |
| Canadians | 99.6 /100 | #74 | Exceptional 94.9% |
| Okinawans | 99.5 /100 | #75 | Exceptional 94.8% |
| Romanians | 99.5 /100 | #76 | Exceptional 94.8% |
Demographics Similar to Nicaraguans by 10th Grade
In terms of 10th grade, the demographic groups most similar to Nicaraguans are Houma (90.2%, a difference of 0.010%), Belizean (90.2%, a difference of 0.010%), Tohono O'odham (90.1%, a difference of 0.020%), Immigrants from Cuba (90.2%, a difference of 0.080%), and Immigrants from Belize (90.1%, a difference of 0.11%).
| Demographics | Rating | Rank | 10th Grade |
| Immigrants | Portugal | 0.0 /100 | #312 | Tragic 90.8% |
| Cape Verdeans | 0.0 /100 | #313 | Tragic 90.8% |
| Nepalese | 0.0 /100 | #314 | Tragic 90.7% |
| Immigrants | Caribbean | 0.0 /100 | #315 | Tragic 90.6% |
| Ecuadorians | 0.0 /100 | #316 | Tragic 90.6% |
| Immigrants | Ecuador | 0.0 /100 | #317 | Tragic 90.4% |
| Immigrants | Cuba | 0.0 /100 | #318 | Tragic 90.2% |
| Nicaraguans | 0.0 /100 | #319 | Tragic 90.2% |
| Houma | 0.0 /100 | #320 | Tragic 90.2% |
| Belizeans | 0.0 /100 | #321 | Tragic 90.2% |
| Tohono O'odham | 0.0 /100 | #322 | Tragic 90.1% |
| Immigrants | Belize | 0.0 /100 | #323 | Tragic 90.1% |
| Immigrants | Armenia | 0.0 /100 | #324 | Tragic 89.9% |
| Puerto Ricans | 0.0 /100 | #325 | Tragic 89.8% |
| Central American Indians | 0.0 /100 | #326 | Tragic 89.7% |