Immigrants from England vs Immigrants from Kuwait In Labor Force | Age 20-64
COMPARE
Immigrants from England
Immigrants from Kuwait
In Labor Force | Age 20-64
In Labor Force | Age 20-64 Comparison
Immigrants from England
Immigrants from Kuwait
79.2%
IN LABOR FORCE | AGE 20-64
9.3/ 100
METRIC RATING
218th/ 347
METRIC RANK
80.0%
IN LABOR FORCE | AGE 20-64
92.2/ 100
METRIC RATING
121st/ 347
METRIC RANK
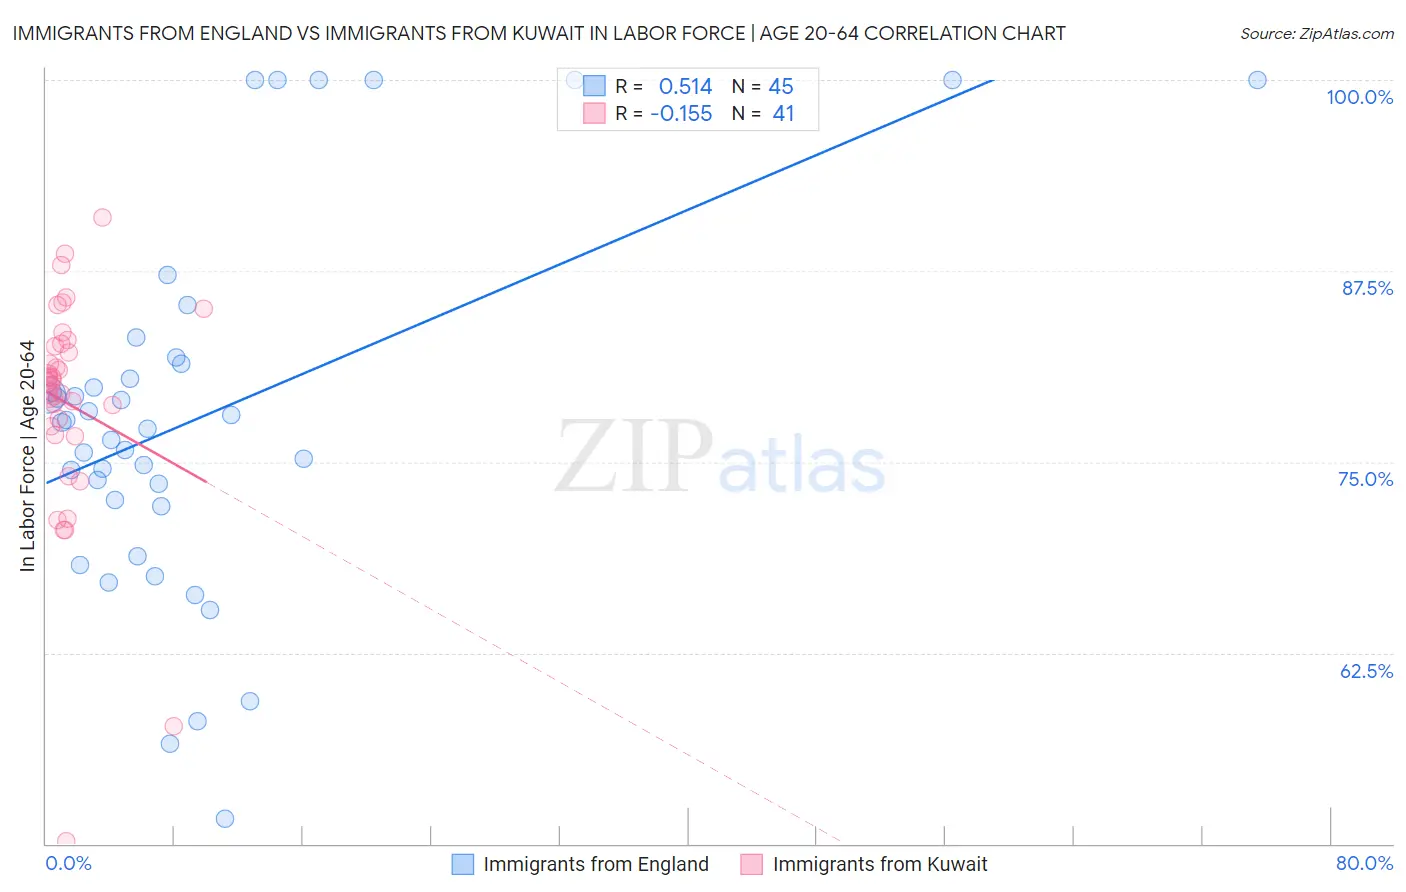
Immigrants from England vs Immigrants from Kuwait In Labor Force | Age 20-64 Correlation Chart
The statistical analysis conducted on geographies consisting of 391,897,743 people shows a substantial positive correlation between the proportion of Immigrants from England and labor force participation rate among population between the ages 20 and 64 in the United States with a correlation coefficient (R) of 0.514 and weighted average of 79.2%. Similarly, the statistical analysis conducted on geographies consisting of 136,914,961 people shows a poor negative correlation between the proportion of Immigrants from Kuwait and labor force participation rate among population between the ages 20 and 64 in the United States with a correlation coefficient (R) of -0.155 and weighted average of 80.0%, a difference of 0.96%.
In Labor Force | Age 20-64 Correlation Summary
| Measurement | Immigrants from England | Immigrants from Kuwait |
| Minimum | 51.6% | 50.2% |
| Maximum | 100.0% | 91.0% |
| Range | 48.4% | 40.8% |
| Mean | 78.0% | 78.8% |
| Median | 77.6% | 80.2% |
| Interquartile 25% (IQ1) | 72.3% | 77.0% |
| Interquartile 75% (IQ3) | 81.6% | 82.7% |
| Interquartile Range (IQR) | 9.3% | 5.7% |
| Standard Deviation (Sample) | 12.0% | 7.4% |
| Standard Deviation (Population) | 11.9% | 7.3% |
Similar Demographics by In Labor Force | Age 20-64
Demographics Similar to Immigrants from England by In Labor Force | Age 20-64
In terms of in labor force | age 20-64, the demographic groups most similar to Immigrants from England are French Canadian (79.2%, a difference of 0.020%), Immigrants from Western Asia (79.2%, a difference of 0.040%), Immigrants (79.2%, a difference of 0.040%), Arab (79.2%, a difference of 0.050%), and Immigrants from Armenia (79.2%, a difference of 0.060%).
| Demographics | Rating | Rank | In Labor Force | Age 20-64 |
| Europeans | 15.3 /100 | #211 | Poor 79.3% |
| Irish | 13.2 /100 | #212 | Poor 79.3% |
| Immigrants | Portugal | 12.8 /100 | #213 | Poor 79.3% |
| Immigrants | Armenia | 12.2 /100 | #214 | Poor 79.2% |
| Immigrants | Norway | 12.0 /100 | #215 | Poor 79.2% |
| Arabs | 11.4 /100 | #216 | Poor 79.2% |
| Immigrants | Western Asia | 11.0 /100 | #217 | Poor 79.2% |
| Immigrants | England | 9.3 /100 | #218 | Tragic 79.2% |
| French Canadians | 8.4 /100 | #219 | Tragic 79.2% |
| Immigrants | Immigrants | 7.7 /100 | #220 | Tragic 79.2% |
| Hungarians | 7.2 /100 | #221 | Tragic 79.2% |
| Immigrants | Panama | 6.9 /100 | #222 | Tragic 79.1% |
| Canadians | 6.8 /100 | #223 | Tragic 79.1% |
| Immigrants | Uzbekistan | 6.8 /100 | #224 | Tragic 79.1% |
| Portuguese | 6.4 /100 | #225 | Tragic 79.1% |
Demographics Similar to Immigrants from Kuwait by In Labor Force | Age 20-64
In terms of in labor force | age 20-64, the demographic groups most similar to Immigrants from Kuwait are Immigrants from Vietnam (80.0%, a difference of 0.010%), Cape Verdean (80.0%, a difference of 0.010%), Immigrants from Taiwan (80.0%, a difference of 0.010%), Maltese (80.0%, a difference of 0.010%), and Mongolian (79.9%, a difference of 0.010%).
| Demographics | Rating | Rank | In Labor Force | Age 20-64 |
| Argentineans | 93.8 /100 | #114 | Exceptional 80.0% |
| Bermudans | 93.3 /100 | #115 | Exceptional 80.0% |
| Immigrants | Western Africa | 93.1 /100 | #116 | Exceptional 80.0% |
| Immigrants | Vietnam | 92.7 /100 | #117 | Exceptional 80.0% |
| Cape Verdeans | 92.7 /100 | #118 | Exceptional 80.0% |
| Immigrants | Taiwan | 92.5 /100 | #119 | Exceptional 80.0% |
| Maltese | 92.4 /100 | #120 | Exceptional 80.0% |
| Immigrants | Kuwait | 92.2 /100 | #121 | Exceptional 80.0% |
| Mongolians | 92.0 /100 | #122 | Exceptional 79.9% |
| Immigrants | Russia | 91.8 /100 | #123 | Exceptional 79.9% |
| Immigrants | Europe | 91.6 /100 | #124 | Exceptional 79.9% |
| Danes | 91.5 /100 | #125 | Exceptional 79.9% |
| Immigrants | France | 90.7 /100 | #126 | Exceptional 79.9% |
| Immigrants | Czechoslovakia | 89.7 /100 | #127 | Excellent 79.9% |
| Immigrants | Eastern Asia | 89.4 /100 | #128 | Excellent 79.9% |