Immigrants from England vs Ecuadorian Unemployment Among Ages 35 to 44 years
COMPARE
Immigrants from England
Ecuadorian
Unemployment Among Ages 35 to 44 years
Unemployment Among Ages 35 to 44 years Comparison
Immigrants from England
Ecuadorians
4.6%
UNEMPLOYMENT AMONG AGES 35 TO 44 YEARS
70.5/ 100
METRIC RATING
150th/ 347
METRIC RANK
5.4%
UNEMPLOYMENT AMONG AGES 35 TO 44 YEARS
0.0/ 100
METRIC RATING
280th/ 347
METRIC RANK
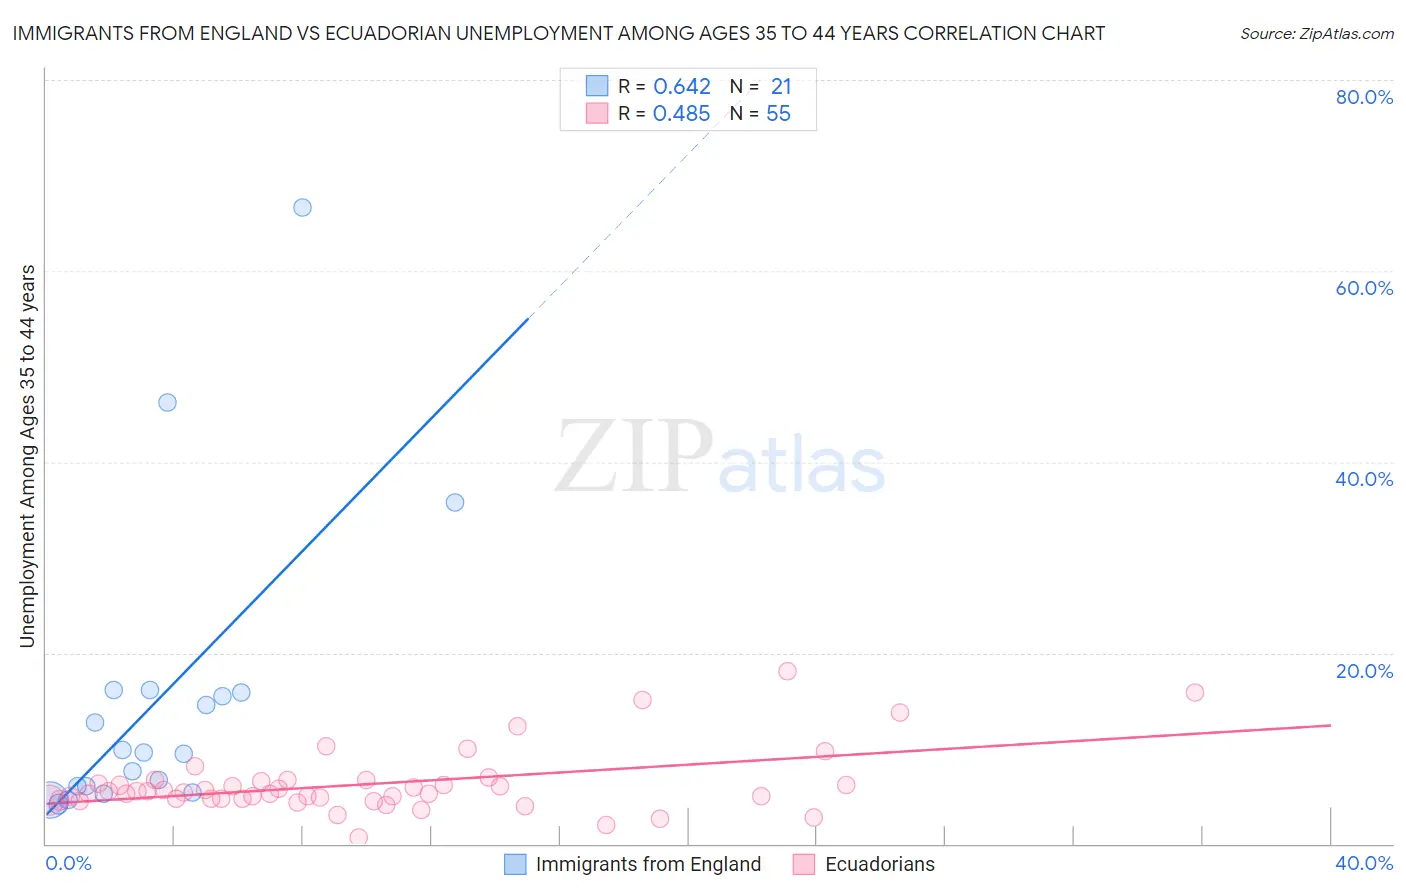
Immigrants from England vs Ecuadorian Unemployment Among Ages 35 to 44 years Correlation Chart
The statistical analysis conducted on geographies consisting of 382,025,174 people shows a significant positive correlation between the proportion of Immigrants from England and unemployment rate among population between the ages 35 and 44 in the United States with a correlation coefficient (R) of 0.642 and weighted average of 4.6%. Similarly, the statistical analysis conducted on geographies consisting of 313,191,229 people shows a moderate positive correlation between the proportion of Ecuadorians and unemployment rate among population between the ages 35 and 44 in the United States with a correlation coefficient (R) of 0.485 and weighted average of 5.4%, a difference of 16.8%.
Unemployment Among Ages 35 to 44 years Correlation Summary
| Measurement | Immigrants from England | Ecuadorian |
| Minimum | 4.1% | 0.66% |
| Maximum | 66.7% | 18.1% |
| Range | 62.6% | 17.4% |
| Mean | 15.1% | 6.2% |
| Median | 9.5% | 5.4% |
| Interquartile 25% (IQ1) | 5.7% | 4.7% |
| Interquartile 75% (IQ3) | 15.9% | 6.6% |
| Interquartile Range (IQR) | 10.3% | 1.9% |
| Standard Deviation (Sample) | 15.8% | 3.3% |
| Standard Deviation (Population) | 15.4% | 3.3% |
Similar Demographics by Unemployment Among Ages 35 to 44 years
Demographics Similar to Immigrants from England by Unemployment Among Ages 35 to 44 years
In terms of unemployment among ages 35 to 44 years, the demographic groups most similar to Immigrants from England are Immigrants from Burma/Myanmar (4.6%, a difference of 0.15%), Slavic (4.6%, a difference of 0.17%), Immigrants from Vietnam (4.6%, a difference of 0.29%), Puget Sound Salish (4.6%, a difference of 0.29%), and Pakistani (4.6%, a difference of 0.29%).
| Demographics | Rating | Rank | Unemployment Among Ages 35 to 44 years |
| Immigrants | Switzerland | 75.5 /100 | #143 | Good 4.6% |
| Immigrants | Russia | 75.4 /100 | #144 | Good 4.6% |
| Immigrants | Eastern Europe | 74.7 /100 | #145 | Good 4.6% |
| Immigrants | Denmark | 74.4 /100 | #146 | Good 4.6% |
| Immigrants | Vietnam | 73.8 /100 | #147 | Good 4.6% |
| Slavs | 72.4 /100 | #148 | Good 4.6% |
| Immigrants | Burma/Myanmar | 72.2 /100 | #149 | Good 4.6% |
| Immigrants | England | 70.5 /100 | #150 | Good 4.6% |
| Puget Sound Salish | 67.1 /100 | #151 | Good 4.6% |
| Pakistanis | 67.1 /100 | #152 | Good 4.6% |
| Immigrants | Brazil | 67.0 /100 | #153 | Good 4.6% |
| Immigrants | Western Europe | 65.5 /100 | #154 | Good 4.6% |
| Whites/Caucasians | 64.9 /100 | #155 | Good 4.6% |
| South Americans | 63.7 /100 | #156 | Good 4.6% |
| Immigrants | Belarus | 63.4 /100 | #157 | Good 4.6% |
Demographics Similar to Ecuadorians by Unemployment Among Ages 35 to 44 years
In terms of unemployment among ages 35 to 44 years, the demographic groups most similar to Ecuadorians are Immigrants from Portugal (5.4%, a difference of 0.050%), Immigrants from Senegal (5.4%, a difference of 0.17%), Lumbee (5.4%, a difference of 0.22%), Immigrants from Ghana (5.4%, a difference of 0.43%), and Immigrants from Caribbean (5.4%, a difference of 0.45%).
| Demographics | Rating | Rank | Unemployment Among Ages 35 to 44 years |
| Vietnamese | 0.0 /100 | #273 | Tragic 5.4% |
| Creek | 0.0 /100 | #274 | Tragic 5.4% |
| Immigrants | Mexico | 0.0 /100 | #275 | Tragic 5.4% |
| Native Hawaiians | 0.0 /100 | #276 | Tragic 5.4% |
| Immigrants | Caribbean | 0.0 /100 | #277 | Tragic 5.4% |
| Lumbee | 0.0 /100 | #278 | Tragic 5.4% |
| Immigrants | Senegal | 0.0 /100 | #279 | Tragic 5.4% |
| Ecuadorians | 0.0 /100 | #280 | Tragic 5.4% |
| Immigrants | Portugal | 0.0 /100 | #281 | Tragic 5.4% |
| Immigrants | Ghana | 0.0 /100 | #282 | Tragic 5.4% |
| Immigrants | Ecuador | 0.0 /100 | #283 | Tragic 5.4% |
| Haitians | 0.0 /100 | #284 | Tragic 5.5% |
| Hispanics or Latinos | 0.0 /100 | #285 | Tragic 5.5% |
| Immigrants | Micronesia | 0.0 /100 | #286 | Tragic 5.5% |
| French American Indians | 0.0 /100 | #287 | Tragic 5.5% |