Cajun vs New Zealander Bachelor's Degree
COMPARE
Cajun
New Zealander
Bachelor's Degree
Bachelor's Degree Comparison
Cajuns
New Zealanders
29.6%
BACHELOR'S DEGREE
0.0/ 100
METRIC RATING
308th/ 347
METRIC RANK
44.0%
BACHELOR'S DEGREE
99.9/ 100
METRIC RATING
60th/ 347
METRIC RANK
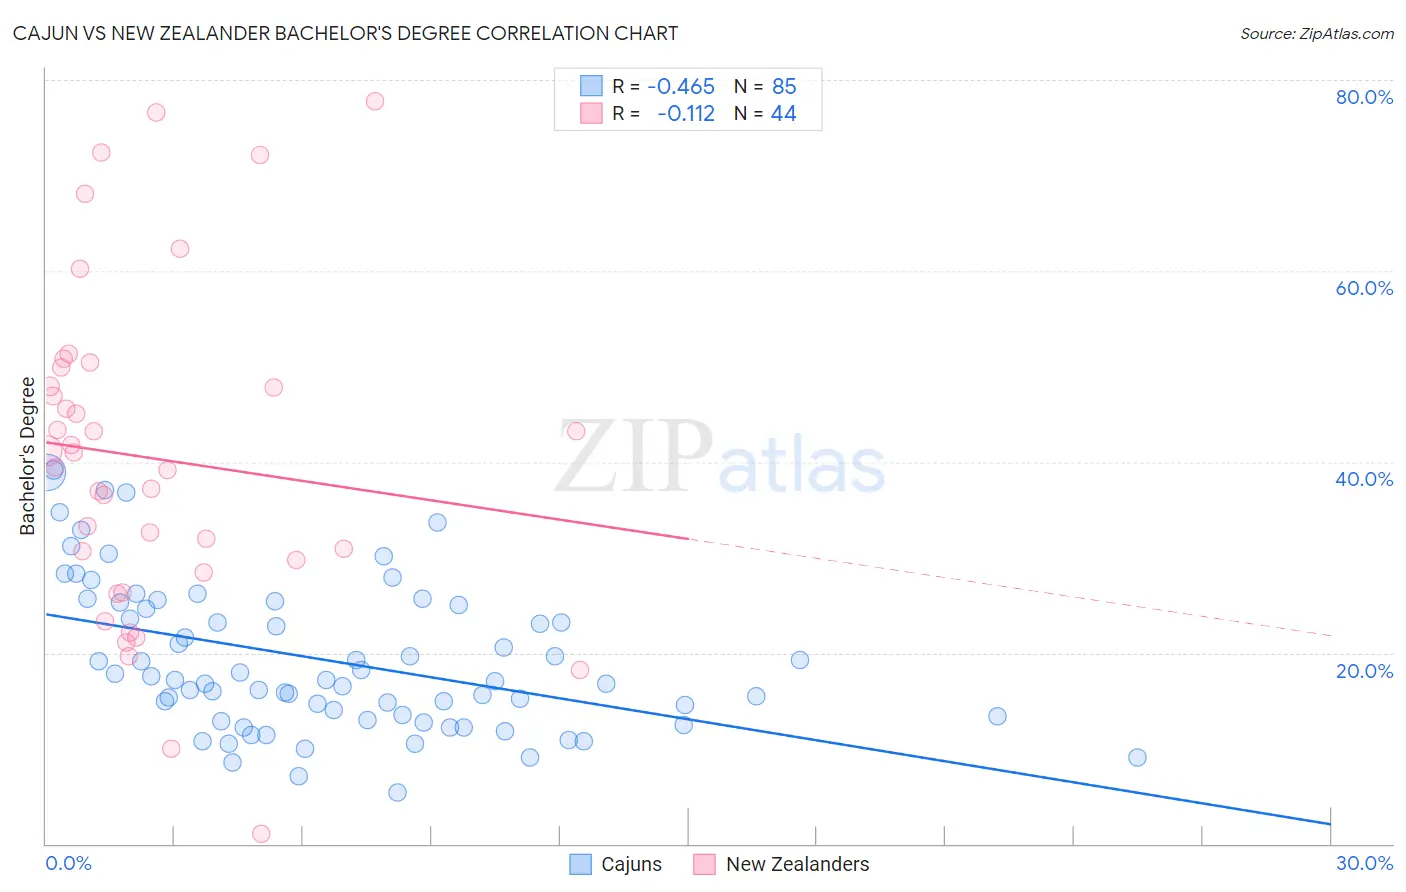
Cajun vs New Zealander Bachelor's Degree Correlation Chart
The statistical analysis conducted on geographies consisting of 149,707,155 people shows a moderate negative correlation between the proportion of Cajuns and percentage of population with at least bachelor's degree education in the United States with a correlation coefficient (R) of -0.465 and weighted average of 29.6%. Similarly, the statistical analysis conducted on geographies consisting of 106,915,831 people shows a poor negative correlation between the proportion of New Zealanders and percentage of population with at least bachelor's degree education in the United States with a correlation coefficient (R) of -0.112 and weighted average of 44.0%, a difference of 48.4%.
Bachelor's Degree Correlation Summary
| Measurement | Cajun | New Zealander |
| Minimum | 5.4% | 1.0% |
| Maximum | 39.1% | 77.8% |
| Range | 33.8% | 76.8% |
| Mean | 19.2% | 40.3% |
| Median | 17.1% | 40.2% |
| Interquartile 25% (IQ1) | 13.2% | 29.1% |
| Interquartile 75% (IQ3) | 25.1% | 48.9% |
| Interquartile Range (IQR) | 11.9% | 19.8% |
| Standard Deviation (Sample) | 7.8% | 17.3% |
| Standard Deviation (Population) | 7.8% | 17.1% |
Similar Demographics by Bachelor's Degree
Demographics Similar to Cajuns by Bachelor's Degree
In terms of bachelor's degree, the demographic groups most similar to Cajuns are Hispanic or Latino (29.6%, a difference of 0.18%), Cheyenne (29.4%, a difference of 0.65%), Choctaw (29.4%, a difference of 0.72%), Seminole (29.4%, a difference of 0.78%), and Nepalese (29.9%, a difference of 0.86%).
| Demographics | Rating | Rank | Bachelor's Degree |
| Immigrants | Cuba | 0.0 /100 | #301 | Tragic 30.3% |
| Mexican American Indians | 0.0 /100 | #302 | Tragic 30.2% |
| Bangladeshis | 0.0 /100 | #303 | Tragic 30.2% |
| Cherokee | 0.0 /100 | #304 | Tragic 30.2% |
| Immigrants | Latin America | 0.0 /100 | #305 | Tragic 30.1% |
| Immigrants | Yemen | 0.0 /100 | #306 | Tragic 29.9% |
| Nepalese | 0.0 /100 | #307 | Tragic 29.9% |
| Cajuns | 0.0 /100 | #308 | Tragic 29.6% |
| Hispanics or Latinos | 0.0 /100 | #309 | Tragic 29.6% |
| Cheyenne | 0.0 /100 | #310 | Tragic 29.4% |
| Choctaw | 0.0 /100 | #311 | Tragic 29.4% |
| Seminole | 0.0 /100 | #312 | Tragic 29.4% |
| Alaska Natives | 0.0 /100 | #313 | Tragic 29.4% |
| Shoshone | 0.0 /100 | #314 | Tragic 29.3% |
| Immigrants | Cabo Verde | 0.0 /100 | #315 | Tragic 29.2% |
Demographics Similar to New Zealanders by Bachelor's Degree
In terms of bachelor's degree, the demographic groups most similar to New Zealanders are Australian (44.0%, a difference of 0.010%), Immigrants from Czechoslovakia (44.0%, a difference of 0.11%), Paraguayan (44.0%, a difference of 0.16%), Immigrants from Serbia (44.1%, a difference of 0.35%), and Immigrants from Bolivia (44.2%, a difference of 0.53%).
| Demographics | Rating | Rank | Bachelor's Degree |
| Immigrants | Asia | 99.9 /100 | #53 | Exceptional 44.3% |
| Immigrants | Austria | 99.9 /100 | #54 | Exceptional 44.2% |
| Immigrants | Bolivia | 99.9 /100 | #55 | Exceptional 44.2% |
| Immigrants | Serbia | 99.9 /100 | #56 | Exceptional 44.1% |
| Paraguayans | 99.9 /100 | #57 | Exceptional 44.0% |
| Immigrants | Czechoslovakia | 99.9 /100 | #58 | Exceptional 44.0% |
| Australians | 99.9 /100 | #59 | Exceptional 44.0% |
| New Zealanders | 99.9 /100 | #60 | Exceptional 44.0% |
| South Africans | 99.8 /100 | #61 | Exceptional 43.6% |
| Immigrants | Kazakhstan | 99.8 /100 | #62 | Exceptional 43.4% |
| Immigrants | Europe | 99.8 /100 | #63 | Exceptional 43.4% |
| Argentineans | 99.7 /100 | #64 | Exceptional 43.3% |
| Zimbabweans | 99.7 /100 | #65 | Exceptional 43.3% |
| Immigrants | Netherlands | 99.7 /100 | #66 | Exceptional 43.3% |
| Egyptians | 99.7 /100 | #67 | Exceptional 43.3% |