Immigrants from El Salvador vs Immigrants from Barbados GED/Equivalency
COMPARE
Immigrants from El Salvador
Immigrants from Barbados
GED/Equivalency
GED/Equivalency Comparison
Immigrants from El Salvador
Immigrants from Barbados
77.6%
GED/EQUIVALENCY
0.0/ 100
METRIC RATING
339th/ 347
METRIC RANK
82.4%
GED/EQUIVALENCY
0.1/ 100
METRIC RATING
284th/ 347
METRIC RANK
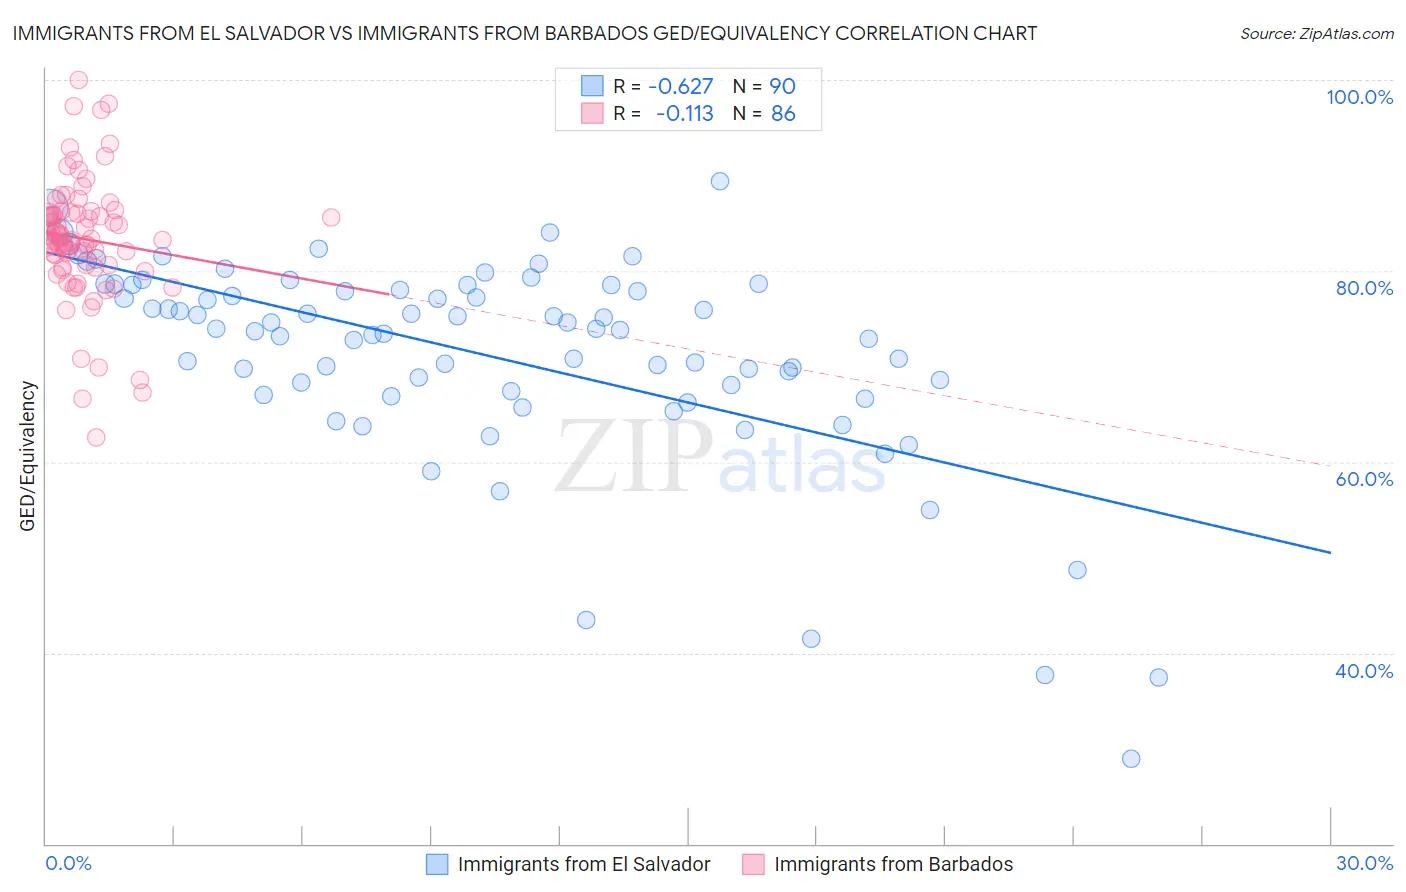
Immigrants from El Salvador vs Immigrants from Barbados GED/Equivalency Correlation Chart
The statistical analysis conducted on geographies consisting of 357,852,938 people shows a significant negative correlation between the proportion of Immigrants from El Salvador and percentage of population with at least ged/equivalency education in the United States with a correlation coefficient (R) of -0.627 and weighted average of 77.6%. Similarly, the statistical analysis conducted on geographies consisting of 112,783,324 people shows a poor negative correlation between the proportion of Immigrants from Barbados and percentage of population with at least ged/equivalency education in the United States with a correlation coefficient (R) of -0.113 and weighted average of 82.4%, a difference of 6.2%.
GED/Equivalency Correlation Summary
| Measurement | Immigrants from El Salvador | Immigrants from Barbados |
| Minimum | 29.0% | 62.6% |
| Maximum | 89.4% | 100.0% |
| Range | 60.4% | 37.4% |
| Mean | 71.2% | 83.4% |
| Median | 73.8% | 83.5% |
| Interquartile 25% (IQ1) | 67.4% | 80.6% |
| Interquartile 75% (IQ3) | 78.5% | 86.1% |
| Interquartile Range (IQR) | 11.1% | 5.5% |
| Standard Deviation (Sample) | 10.9% | 6.4% |
| Standard Deviation (Population) | 10.8% | 6.4% |
Similar Demographics by GED/Equivalency
Demographics Similar to Immigrants from El Salvador by GED/Equivalency
In terms of ged/equivalency, the demographic groups most similar to Immigrants from El Salvador are Tohono O'odham (77.5%, a difference of 0.16%), Mexican (77.4%, a difference of 0.24%), Immigrants from Guatemala (77.9%, a difference of 0.38%), Immigrants from Yemen (77.9%, a difference of 0.41%), and Immigrants from Dominican Republic (78.0%, a difference of 0.47%).
| Demographics | Rating | Rank | GED/Equivalency |
| Immigrants | Azores | 0.0 /100 | #332 | Tragic 78.7% |
| Salvadorans | 0.0 /100 | #333 | Tragic 78.6% |
| Guatemalans | 0.0 /100 | #334 | Tragic 78.5% |
| Immigrants | Latin America | 0.0 /100 | #335 | Tragic 78.5% |
| Immigrants | Dominican Republic | 0.0 /100 | #336 | Tragic 78.0% |
| Immigrants | Yemen | 0.0 /100 | #337 | Tragic 77.9% |
| Immigrants | Guatemala | 0.0 /100 | #338 | Tragic 77.9% |
| Immigrants | El Salvador | 0.0 /100 | #339 | Tragic 77.6% |
| Tohono O'odham | 0.0 /100 | #340 | Tragic 77.5% |
| Mexicans | 0.0 /100 | #341 | Tragic 77.4% |
| Pima | 0.0 /100 | #342 | Tragic 76.4% |
| Immigrants | Central America | 0.0 /100 | #343 | Tragic 76.4% |
| Spanish American Indians | 0.0 /100 | #344 | Tragic 76.3% |
| Immigrants | Mexico | 0.0 /100 | #345 | Tragic 75.7% |
| Houma | 0.0 /100 | #346 | Tragic 75.0% |
Demographics Similar to Immigrants from Barbados by GED/Equivalency
In terms of ged/equivalency, the demographic groups most similar to Immigrants from Barbados are Cajun (82.4%, a difference of 0.030%), Immigrants from West Indies (82.4%, a difference of 0.060%), Japanese (82.4%, a difference of 0.070%), Indonesian (82.5%, a difference of 0.12%), and Immigrants (82.6%, a difference of 0.16%).
| Demographics | Rating | Rank | GED/Equivalency |
| Arapaho | 0.1 /100 | #277 | Tragic 82.8% |
| Immigrants | Laos | 0.1 /100 | #278 | Tragic 82.7% |
| Immigrants | Fiji | 0.1 /100 | #279 | Tragic 82.7% |
| Cheyenne | 0.1 /100 | #280 | Tragic 82.7% |
| Sioux | 0.1 /100 | #281 | Tragic 82.6% |
| Immigrants | Immigrants | 0.1 /100 | #282 | Tragic 82.6% |
| Indonesians | 0.1 /100 | #283 | Tragic 82.5% |
| Immigrants | Barbados | 0.1 /100 | #284 | Tragic 82.4% |
| Cajuns | 0.0 /100 | #285 | Tragic 82.4% |
| Immigrants | West Indies | 0.0 /100 | #286 | Tragic 82.4% |
| Japanese | 0.0 /100 | #287 | Tragic 82.4% |
| Pueblo | 0.0 /100 | #288 | Tragic 82.3% |
| Immigrants | Cambodia | 0.0 /100 | #289 | Tragic 82.2% |
| Haitians | 0.0 /100 | #290 | Tragic 82.1% |
| Cubans | 0.0 /100 | #291 | Tragic 82.0% |