Immigrants from El Salvador vs Immigrants from Barbados Unemployment Among Women with Children Under 18 years
COMPARE
Immigrants from El Salvador
Immigrants from Barbados
Unemployment Among Women with Children Under 18 years
Unemployment Among Women with Children Under 18 years Comparison
Immigrants from El Salvador
Immigrants from Barbados
6.3%
UNEMPLOYMENT AMONG WOMEN WITH CHILDREN UNDER 18 YEARS
0.0/ 100
METRIC RATING
281st/ 347
METRIC RANK
6.2%
UNEMPLOYMENT AMONG WOMEN WITH CHILDREN UNDER 18 YEARS
0.0/ 100
METRIC RATING
278th/ 347
METRIC RANK
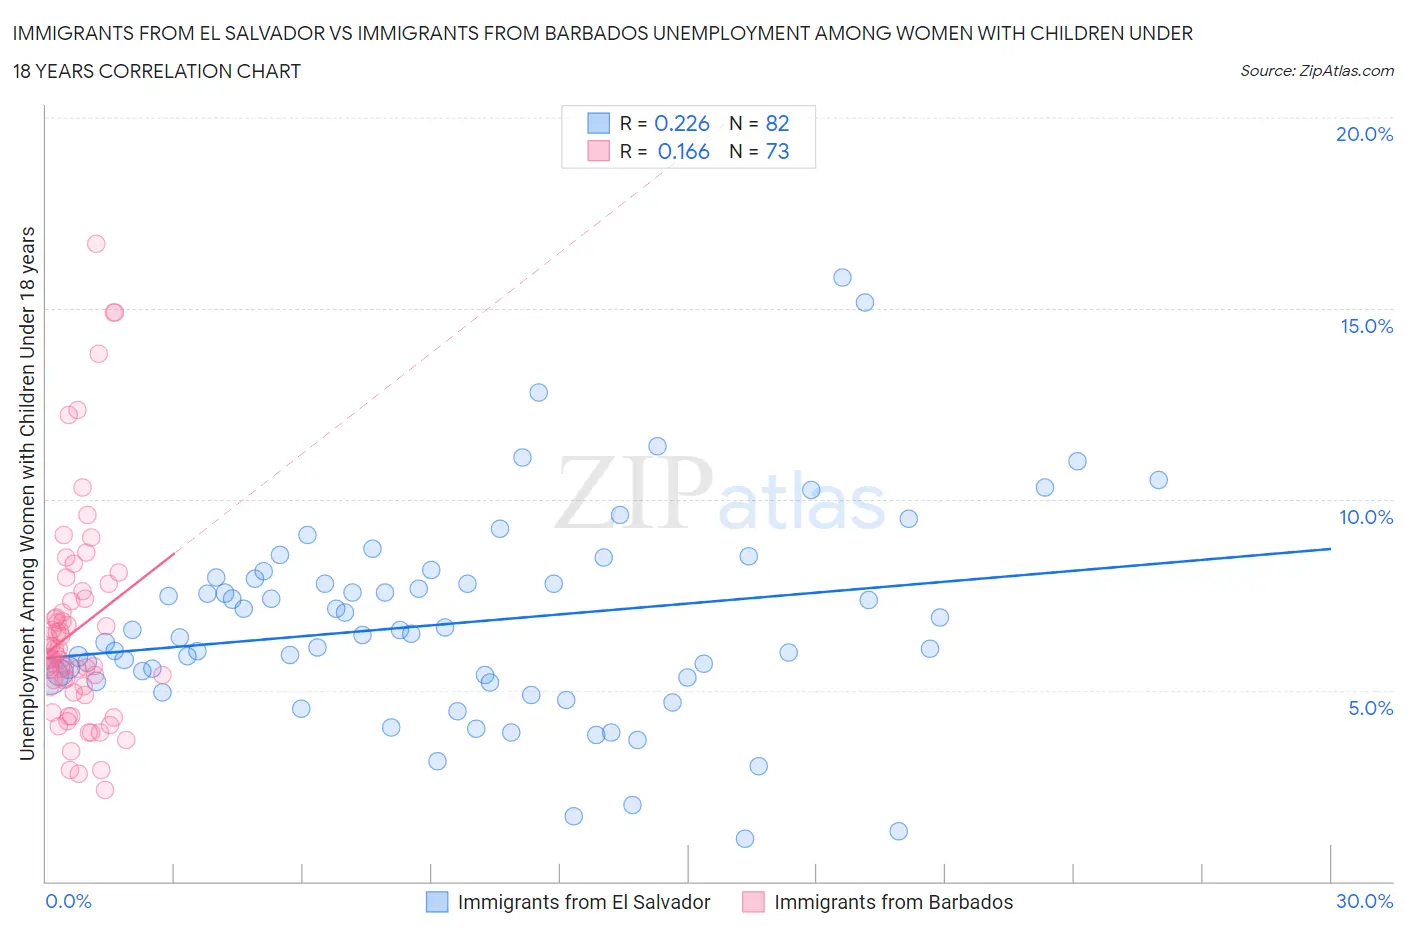
Immigrants from El Salvador vs Immigrants from Barbados Unemployment Among Women with Children Under 18 years Correlation Chart
The statistical analysis conducted on geographies consisting of 348,177,746 people shows a weak positive correlation between the proportion of Immigrants from El Salvador and unemployment rate among women with children under the age of 18 in the United States with a correlation coefficient (R) of 0.226 and weighted average of 6.3%. Similarly, the statistical analysis conducted on geographies consisting of 112,091,433 people shows a poor positive correlation between the proportion of Immigrants from Barbados and unemployment rate among women with children under the age of 18 in the United States with a correlation coefficient (R) of 0.166 and weighted average of 6.2%, a difference of 1.1%.
Unemployment Among Women with Children Under 18 years Correlation Summary
| Measurement | Immigrants from El Salvador | Immigrants from Barbados |
| Minimum | 1.1% | 2.4% |
| Maximum | 15.8% | 16.7% |
| Range | 14.7% | 14.3% |
| Mean | 6.8% | 6.6% |
| Median | 6.5% | 5.9% |
| Interquartile 25% (IQ1) | 5.3% | 5.0% |
| Interquartile 75% (IQ3) | 7.9% | 7.4% |
| Interquartile Range (IQR) | 2.6% | 2.3% |
| Standard Deviation (Sample) | 2.7% | 2.8% |
| Standard Deviation (Population) | 2.7% | 2.8% |
Demographics Similar to Immigrants from El Salvador and Immigrants from Barbados by Unemployment Among Women with Children Under 18 years
In terms of unemployment among women with children under 18 years, the demographic groups most similar to Immigrants from El Salvador are Immigrants from St. Vincent and the Grenadines (6.3%, a difference of 0.010%), Guatemalan (6.3%, a difference of 0.16%), West Indian (6.3%, a difference of 0.19%), Immigrants from Grenada (6.3%, a difference of 0.23%), and Bahamian (6.3%, a difference of 0.38%). Similarly, the demographic groups most similar to Immigrants from Barbados are Mexican American Indian (6.2%, a difference of 0.010%), Immigrants from Ghana (6.2%, a difference of 0.030%), Dutch West Indian (6.2%, a difference of 0.13%), Senegalese (6.2%, a difference of 0.31%), and Immigrants from Western Africa (6.2%, a difference of 0.33%).
| Demographics | Rating | Rank | Unemployment Among Women with Children Under 18 years |
| Cajuns | 0.1 /100 | #269 | Tragic 6.2% |
| Ghanaians | 0.1 /100 | #270 | Tragic 6.2% |
| Central Americans | 0.0 /100 | #271 | Tragic 6.2% |
| Salvadorans | 0.0 /100 | #272 | Tragic 6.2% |
| Immigrants | Western Africa | 0.0 /100 | #273 | Tragic 6.2% |
| Senegalese | 0.0 /100 | #274 | Tragic 6.2% |
| Dutch West Indians | 0.0 /100 | #275 | Tragic 6.2% |
| Immigrants | Ghana | 0.0 /100 | #276 | Tragic 6.2% |
| Mexican American Indians | 0.0 /100 | #277 | Tragic 6.2% |
| Immigrants | Barbados | 0.0 /100 | #278 | Tragic 6.2% |
| Immigrants | Portugal | 0.0 /100 | #279 | Tragic 6.3% |
| Guatemalans | 0.0 /100 | #280 | Tragic 6.3% |
| Immigrants | El Salvador | 0.0 /100 | #281 | Tragic 6.3% |
| Immigrants | St. Vincent and the Grenadines | 0.0 /100 | #282 | Tragic 6.3% |
| West Indians | 0.0 /100 | #283 | Tragic 6.3% |
| Immigrants | Grenada | 0.0 /100 | #284 | Tragic 6.3% |
| Bahamians | 0.0 /100 | #285 | Tragic 6.3% |
| Alaskan Athabascans | 0.0 /100 | #286 | Tragic 6.3% |
| Kiowa | 0.0 /100 | #287 | Tragic 6.3% |
| Cree | 0.0 /100 | #288 | Tragic 6.3% |
| Immigrants | Caribbean | 0.0 /100 | #289 | Tragic 6.4% |