Immigrants from Egypt vs Swedish Single Male Poverty
COMPARE
Immigrants from Egypt
Swedish
Single Male Poverty
Single Male Poverty Comparison
Immigrants from Egypt
Swedes
11.4%
SINGLE MALE POVERTY
100.0/ 100
METRIC RATING
29th/ 347
METRIC RANK
13.1%
SINGLE MALE POVERTY
16.8/ 100
METRIC RATING
211th/ 347
METRIC RANK
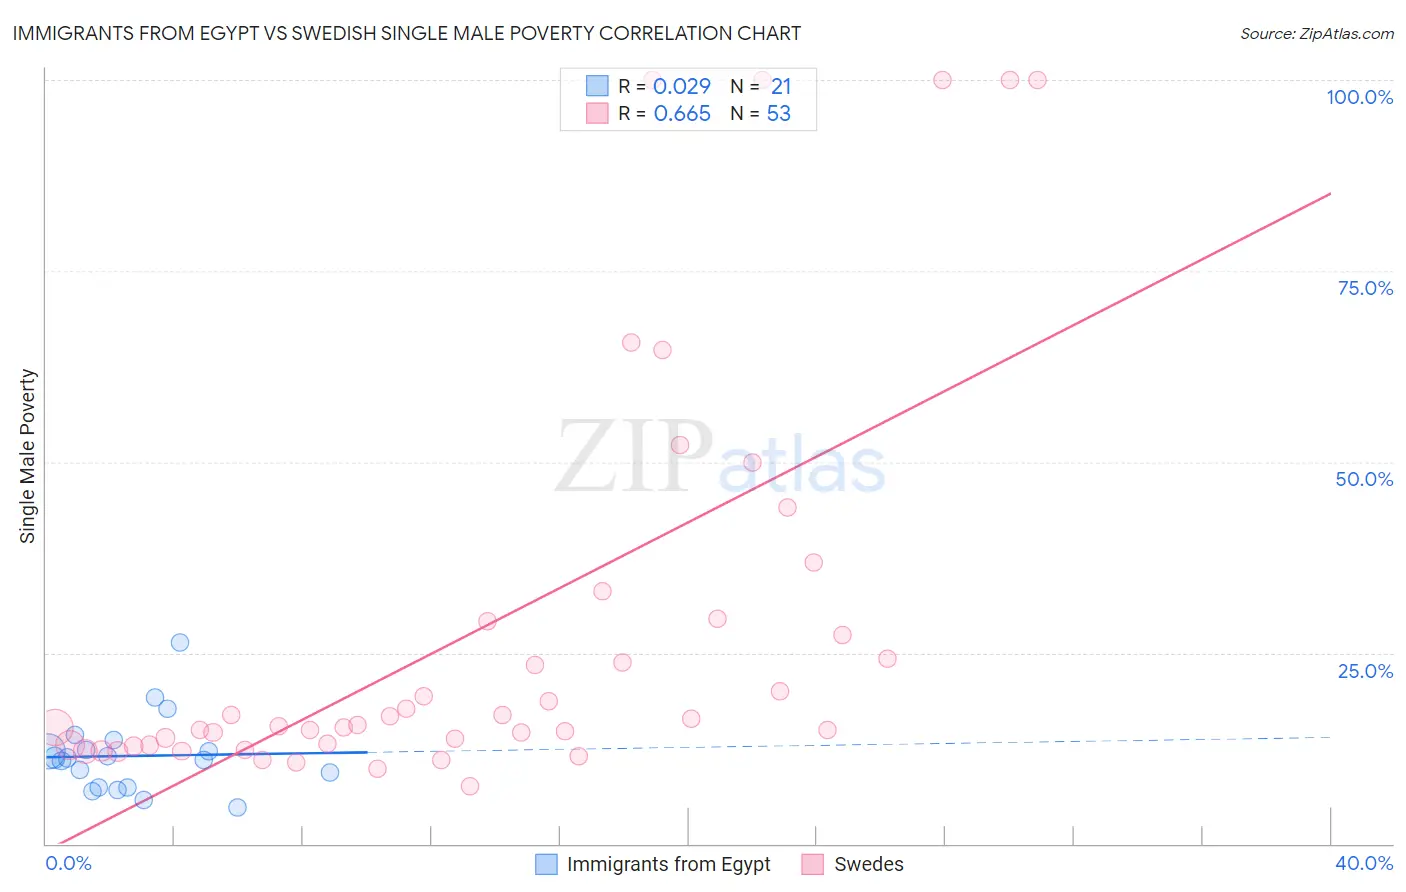
Immigrants from Egypt vs Swedish Single Male Poverty Correlation Chart
The statistical analysis conducted on geographies consisting of 223,464,124 people shows no correlation between the proportion of Immigrants from Egypt and poverty level among single males in the United States with a correlation coefficient (R) of 0.029 and weighted average of 11.4%. Similarly, the statistical analysis conducted on geographies consisting of 449,246,015 people shows a significant positive correlation between the proportion of Swedes and poverty level among single males in the United States with a correlation coefficient (R) of 0.665 and weighted average of 13.1%, a difference of 14.7%.
Single Male Poverty Correlation Summary
| Measurement | Immigrants from Egypt | Swedish |
| Minimum | 4.7% | 7.6% |
| Maximum | 26.3% | 100.0% |
| Range | 21.6% | 92.4% |
| Mean | 11.5% | 28.3% |
| Median | 11.2% | 15.6% |
| Interquartile 25% (IQ1) | 7.3% | 12.9% |
| Interquartile 75% (IQ3) | 12.9% | 29.3% |
| Interquartile Range (IQR) | 5.6% | 16.4% |
| Standard Deviation (Sample) | 5.0% | 26.7% |
| Standard Deviation (Population) | 4.8% | 26.5% |
Similar Demographics by Single Male Poverty
Demographics Similar to Immigrants from Egypt by Single Male Poverty
In terms of single male poverty, the demographic groups most similar to Immigrants from Egypt are Iranian (11.4%, a difference of 0.060%), Immigrants from Asia (11.4%, a difference of 0.10%), Immigrants from Iran (11.4%, a difference of 0.15%), Immigrants from China (11.4%, a difference of 0.17%), and Immigrants from Eastern Asia (11.4%, a difference of 0.24%).
| Demographics | Rating | Rank | Single Male Poverty |
| Immigrants | Pakistan | 100.0 /100 | #22 | Exceptional 11.2% |
| Bolivians | 100.0 /100 | #23 | Exceptional 11.2% |
| Indians (Asian) | 100.0 /100 | #24 | Exceptional 11.3% |
| Maltese | 100.0 /100 | #25 | Exceptional 11.3% |
| Immigrants | Japan | 100.0 /100 | #26 | Exceptional 11.3% |
| Immigrants | China | 100.0 /100 | #27 | Exceptional 11.4% |
| Immigrants | Asia | 100.0 /100 | #28 | Exceptional 11.4% |
| Immigrants | Egypt | 100.0 /100 | #29 | Exceptional 11.4% |
| Iranians | 100.0 /100 | #30 | Exceptional 11.4% |
| Immigrants | Iran | 100.0 /100 | #31 | Exceptional 11.4% |
| Immigrants | Eastern Asia | 100.0 /100 | #32 | Exceptional 11.4% |
| Immigrants | Vietnam | 100.0 /100 | #33 | Exceptional 11.4% |
| Immigrants | Ethiopia | 100.0 /100 | #34 | Exceptional 11.4% |
| Immigrants | South Eastern Asia | 100.0 /100 | #35 | Exceptional 11.4% |
| Immigrants | Serbia | 100.0 /100 | #36 | Exceptional 11.4% |
Demographics Similar to Swedes by Single Male Poverty
In terms of single male poverty, the demographic groups most similar to Swedes are Immigrants from Haiti (13.1%, a difference of 0.010%), Senegalese (13.1%, a difference of 0.030%), Mexican American Indian (13.1%, a difference of 0.060%), Sudanese (13.1%, a difference of 0.080%), and Immigrants from Western Africa (13.1%, a difference of 0.080%).
| Demographics | Rating | Rank | Single Male Poverty |
| Estonians | 20.3 /100 | #204 | Fair 13.0% |
| Poles | 19.3 /100 | #205 | Poor 13.0% |
| Northern Europeans | 18.9 /100 | #206 | Poor 13.0% |
| Sudanese | 17.7 /100 | #207 | Poor 13.1% |
| Immigrants | Western Africa | 17.6 /100 | #208 | Poor 13.1% |
| Mexican American Indians | 17.5 /100 | #209 | Poor 13.1% |
| Immigrants | Haiti | 16.8 /100 | #210 | Poor 13.1% |
| Swedes | 16.8 /100 | #211 | Poor 13.1% |
| Senegalese | 16.4 /100 | #212 | Poor 13.1% |
| Italians | 15.9 /100 | #213 | Poor 13.1% |
| Zimbabweans | 14.9 /100 | #214 | Poor 13.1% |
| Japanese | 14.8 /100 | #215 | Poor 13.1% |
| Austrians | 13.9 /100 | #216 | Poor 13.1% |
| Bermudans | 13.0 /100 | #217 | Poor 13.1% |
| Scandinavians | 12.9 /100 | #218 | Poor 13.1% |