Immigrants from Ecuador vs Immigrants from Ukraine 11th Grade
COMPARE
Immigrants from Ecuador
Immigrants from Ukraine
11th Grade
11th Grade Comparison
Immigrants from Ecuador
Immigrants from Ukraine
89.1%
11TH GRADE
0.0/ 100
METRIC RATING
315th/ 347
METRIC RANK
93.0%
11TH GRADE
89.8/ 100
METRIC RATING
129th/ 347
METRIC RANK
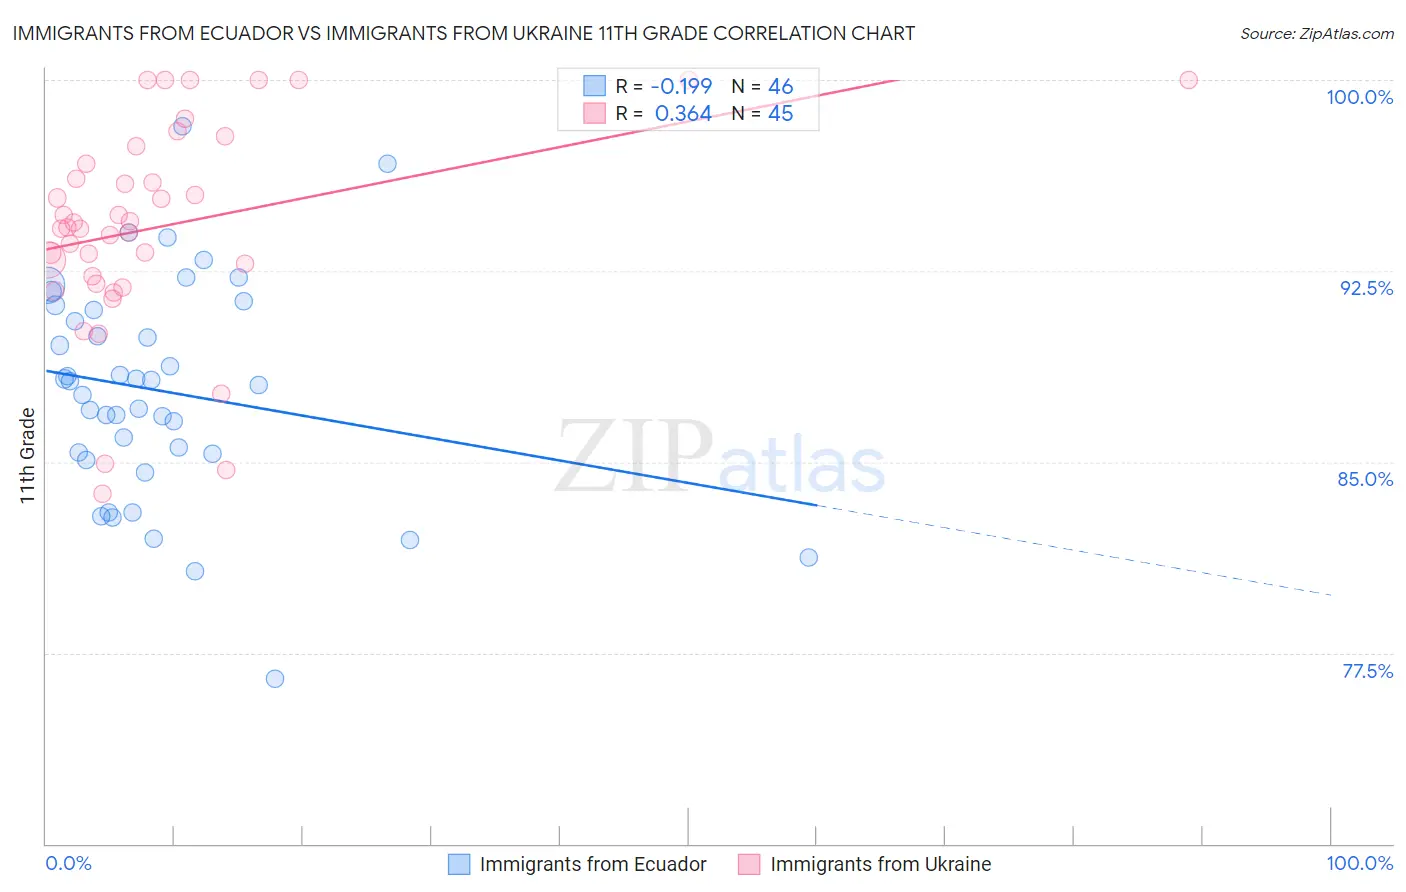
Immigrants from Ecuador vs Immigrants from Ukraine 11th Grade Correlation Chart
The statistical analysis conducted on geographies consisting of 270,907,929 people shows a poor negative correlation between the proportion of Immigrants from Ecuador and percentage of population with at least 11th grade education in the United States with a correlation coefficient (R) of -0.199 and weighted average of 89.1%. Similarly, the statistical analysis conducted on geographies consisting of 289,714,613 people shows a mild positive correlation between the proportion of Immigrants from Ukraine and percentage of population with at least 11th grade education in the United States with a correlation coefficient (R) of 0.364 and weighted average of 93.0%, a difference of 4.4%.
11th Grade Correlation Summary
| Measurement | Immigrants from Ecuador | Immigrants from Ukraine |
| Minimum | 76.5% | 83.8% |
| Maximum | 98.2% | 100.0% |
| Range | 21.7% | 16.2% |
| Mean | 87.8% | 94.3% |
| Median | 88.1% | 94.2% |
| Interquartile 25% (IQ1) | 85.3% | 92.1% |
| Interquartile 75% (IQ3) | 91.0% | 97.1% |
| Interquartile Range (IQR) | 5.7% | 4.9% |
| Standard Deviation (Sample) | 4.3% | 4.0% |
| Standard Deviation (Population) | 4.3% | 4.0% |
Similar Demographics by 11th Grade
Demographics Similar to Immigrants from Ecuador by 11th Grade
In terms of 11th grade, the demographic groups most similar to Immigrants from Ecuador are Cape Verdean (89.1%, a difference of 0.010%), Immigrants from Caribbean (89.1%, a difference of 0.030%), Immigrants from Cuba (88.9%, a difference of 0.15%), Lumbee (88.9%, a difference of 0.16%), and Nicaraguan (88.9%, a difference of 0.22%).
| Demographics | Rating | Rank | 11th Grade |
| Nepalese | 0.0 /100 | #308 | Tragic 89.5% |
| Immigrants | Bangladesh | 0.0 /100 | #309 | Tragic 89.5% |
| Yaqui | 0.0 /100 | #310 | Tragic 89.5% |
| Vietnamese | 0.0 /100 | #311 | Tragic 89.4% |
| Immigrants | Portugal | 0.0 /100 | #312 | Tragic 89.3% |
| Immigrants | Caribbean | 0.0 /100 | #313 | Tragic 89.1% |
| Cape Verdeans | 0.0 /100 | #314 | Tragic 89.1% |
| Immigrants | Ecuador | 0.0 /100 | #315 | Tragic 89.1% |
| Immigrants | Cuba | 0.0 /100 | #316 | Tragic 88.9% |
| Lumbee | 0.0 /100 | #317 | Tragic 88.9% |
| Nicaraguans | 0.0 /100 | #318 | Tragic 88.9% |
| Belizeans | 0.0 /100 | #319 | Tragic 88.8% |
| Immigrants | Armenia | 0.0 /100 | #320 | Tragic 88.8% |
| Immigrants | Belize | 0.0 /100 | #321 | Tragic 88.7% |
| Puerto Ricans | 0.0 /100 | #322 | Tragic 88.4% |
Demographics Similar to Immigrants from Ukraine by 11th Grade
In terms of 11th grade, the demographic groups most similar to Immigrants from Ukraine are Albanian (93.0%, a difference of 0.010%), Egyptian (93.0%, a difference of 0.010%), Immigrants from Bosnia and Herzegovina (93.0%, a difference of 0.020%), Mongolian (93.0%, a difference of 0.050%), and Delaware (93.0%, a difference of 0.060%).
| Demographics | Rating | Rank | 11th Grade |
| Immigrants | Belarus | 96.3 /100 | #122 | Exceptional 93.3% |
| Immigrants | Greece | 95.9 /100 | #123 | Exceptional 93.2% |
| Immigrants | Eastern Europe | 95.9 /100 | #124 | Exceptional 93.2% |
| Immigrants | Sri Lanka | 95.6 /100 | #125 | Exceptional 93.2% |
| Basques | 95.2 /100 | #126 | Exceptional 93.2% |
| Immigrants | Kazakhstan | 92.4 /100 | #127 | Exceptional 93.1% |
| Immigrants | Jordan | 92.4 /100 | #128 | Exceptional 93.1% |
| Immigrants | Ukraine | 89.8 /100 | #129 | Excellent 93.0% |
| Albanians | 89.5 /100 | #130 | Excellent 93.0% |
| Egyptians | 89.5 /100 | #131 | Excellent 93.0% |
| Immigrants | Bosnia and Herzegovina | 89.0 /100 | #132 | Excellent 93.0% |
| Mongolians | 87.6 /100 | #133 | Excellent 93.0% |
| Delaware | 87.3 /100 | #134 | Excellent 93.0% |
| Immigrants | Italy | 86.6 /100 | #135 | Excellent 92.9% |
| Cree | 85.9 /100 | #136 | Excellent 92.9% |