Chickasaw vs Native/Alaskan Bachelor's Degree
COMPARE
Chickasaw
Native/Alaskan
Bachelor's Degree
Bachelor's Degree Comparison
Chickasaw
Natives/Alaskans
30.4%
BACHELOR'S DEGREE
0.0/ 100
METRIC RATING
299th/ 347
METRIC RANK
26.3%
BACHELOR'S DEGREE
0.0/ 100
METRIC RATING
335th/ 347
METRIC RANK
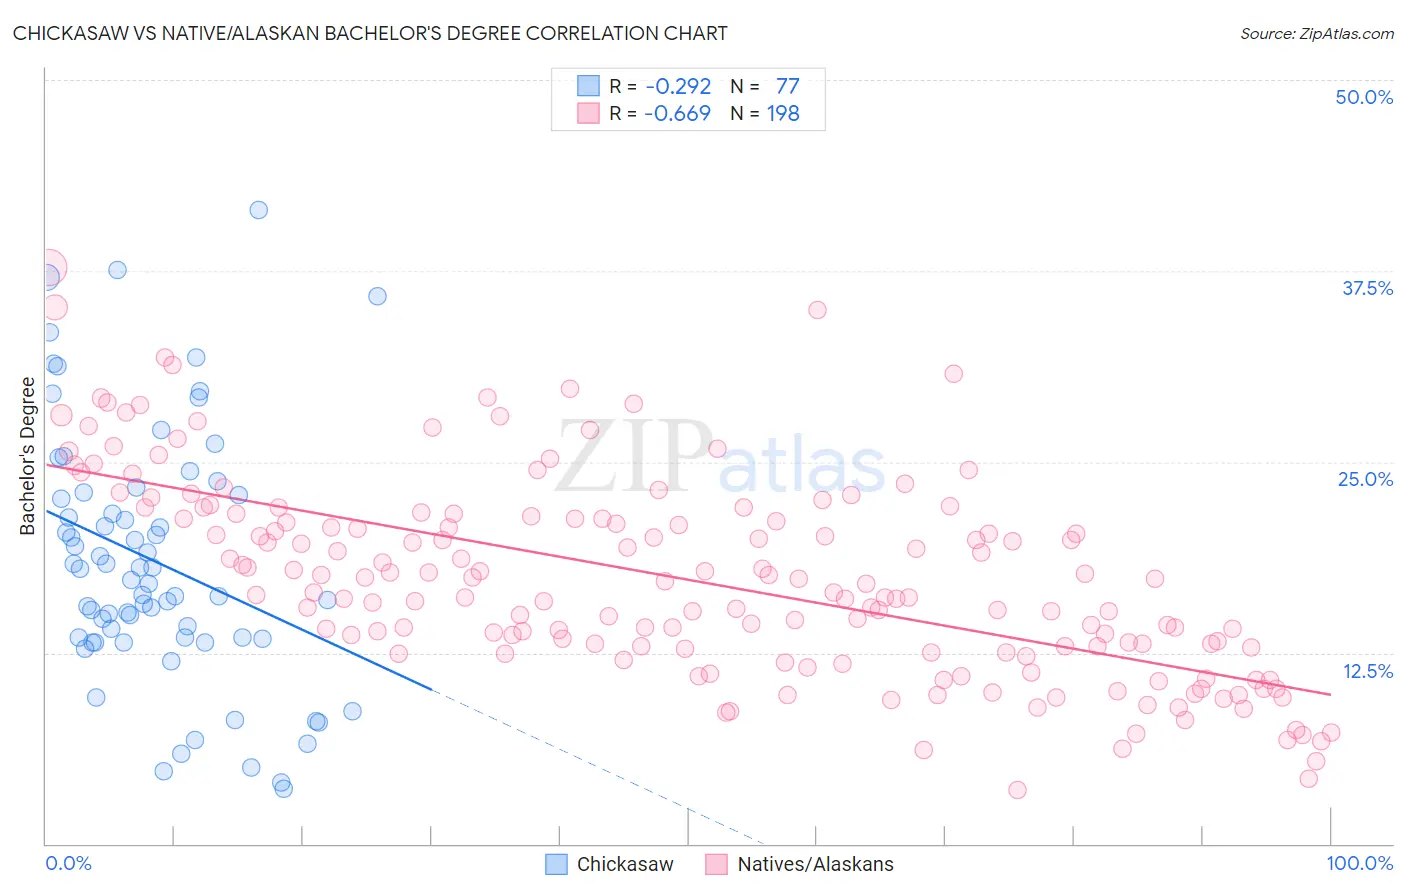
Chickasaw vs Native/Alaskan Bachelor's Degree Correlation Chart
The statistical analysis conducted on geographies consisting of 147,721,658 people shows a weak negative correlation between the proportion of Chickasaw and percentage of population with at least bachelor's degree education in the United States with a correlation coefficient (R) of -0.292 and weighted average of 30.4%. Similarly, the statistical analysis conducted on geographies consisting of 512,966,883 people shows a significant negative correlation between the proportion of Natives/Alaskans and percentage of population with at least bachelor's degree education in the United States with a correlation coefficient (R) of -0.669 and weighted average of 26.3%, a difference of 15.5%.
Bachelor's Degree Correlation Summary
| Measurement | Chickasaw | Native/Alaskan |
| Minimum | 3.6% | 3.5% |
| Maximum | 41.5% | 37.7% |
| Range | 37.9% | 34.2% |
| Mean | 18.5% | 17.3% |
| Median | 17.3% | 16.5% |
| Interquartile 25% (IQ1) | 13.4% | 12.7% |
| Interquartile 75% (IQ3) | 22.9% | 21.3% |
| Interquartile Range (IQR) | 9.5% | 8.6% |
| Standard Deviation (Sample) | 8.3% | 6.5% |
| Standard Deviation (Population) | 8.3% | 6.5% |
Similar Demographics by Bachelor's Degree
Demographics Similar to Chickasaw by Bachelor's Degree
In terms of bachelor's degree, the demographic groups most similar to Chickasaw are Immigrants from Micronesia (30.4%, a difference of 0.020%), Immigrants from Cuba (30.3%, a difference of 0.23%), Mexican American Indian (30.2%, a difference of 0.51%), Chippewa (30.6%, a difference of 0.52%), and Bangladeshi (30.2%, a difference of 0.68%).
| Demographics | Rating | Rank | Bachelor's Degree |
| Ute | 0.1 /100 | #292 | Tragic 30.9% |
| Cape Verdeans | 0.1 /100 | #293 | Tragic 30.9% |
| Immigrants | Guatemala | 0.0 /100 | #294 | Tragic 30.8% |
| Immigrants | Dominican Republic | 0.0 /100 | #295 | Tragic 30.7% |
| Puget Sound Salish | 0.0 /100 | #296 | Tragic 30.7% |
| Immigrants | Haiti | 0.0 /100 | #297 | Tragic 30.6% |
| Chippewa | 0.0 /100 | #298 | Tragic 30.6% |
| Chickasaw | 0.0 /100 | #299 | Tragic 30.4% |
| Immigrants | Micronesia | 0.0 /100 | #300 | Tragic 30.4% |
| Immigrants | Cuba | 0.0 /100 | #301 | Tragic 30.3% |
| Mexican American Indians | 0.0 /100 | #302 | Tragic 30.2% |
| Bangladeshis | 0.0 /100 | #303 | Tragic 30.2% |
| Cherokee | 0.0 /100 | #304 | Tragic 30.2% |
| Immigrants | Latin America | 0.0 /100 | #305 | Tragic 30.1% |
| Immigrants | Yemen | 0.0 /100 | #306 | Tragic 29.9% |
Demographics Similar to Natives/Alaskans by Bachelor's Degree
In terms of bachelor's degree, the demographic groups most similar to Natives/Alaskans are Immigrants from Mexico (26.1%, a difference of 0.70%), Arapaho (26.6%, a difference of 1.1%), Inupiat (25.8%, a difference of 2.0%), Mexican (27.1%, a difference of 2.9%), and Pueblo (25.5%, a difference of 3.1%).
| Demographics | Rating | Rank | Bachelor's Degree |
| Crow | 0.0 /100 | #328 | Tragic 27.7% |
| Immigrants | Central America | 0.0 /100 | #329 | Tragic 27.5% |
| Spanish American Indians | 0.0 /100 | #330 | Tragic 27.5% |
| Immigrants | Azores | 0.0 /100 | #331 | Tragic 27.3% |
| Menominee | 0.0 /100 | #332 | Tragic 27.3% |
| Mexicans | 0.0 /100 | #333 | Tragic 27.1% |
| Arapaho | 0.0 /100 | #334 | Tragic 26.6% |
| Natives/Alaskans | 0.0 /100 | #335 | Tragic 26.3% |
| Immigrants | Mexico | 0.0 /100 | #336 | Tragic 26.1% |
| Inupiat | 0.0 /100 | #337 | Tragic 25.8% |
| Pueblo | 0.0 /100 | #338 | Tragic 25.5% |
| Hopi | 0.0 /100 | #339 | Tragic 25.3% |
| Lumbee | 0.0 /100 | #340 | Tragic 24.8% |
| Yuman | 0.0 /100 | #341 | Tragic 24.5% |
| Yakama | 0.0 /100 | #342 | Tragic 24.5% |