Immigrants from Ecuador vs Immigrants from the Azores In Labor Force | Age > 16
COMPARE
Immigrants from Ecuador
Immigrants from the Azores
In Labor Force | Age > 16
In Labor Force | Age > 16 Comparison
Immigrants from Ecuador
Immigrants from the Azores
65.7%
IN LABOR FORCE | AGE > 16
95.9/ 100
METRIC RATING
122nd/ 347
METRIC RANK
63.6%
IN LABOR FORCE | AGE > 16
0.0/ 100
METRIC RATING
300th/ 347
METRIC RANK
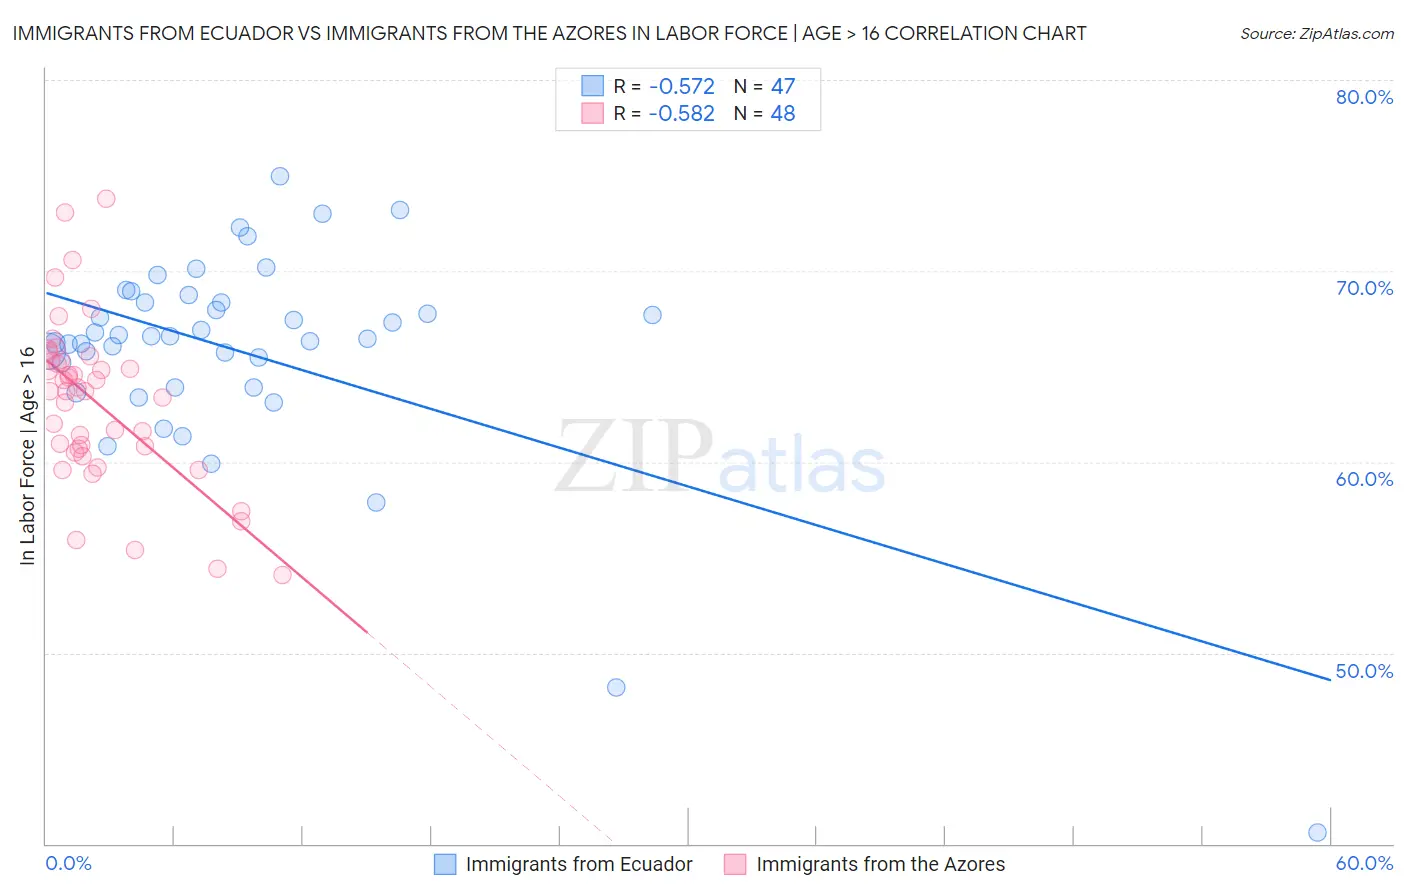
Immigrants from Ecuador vs Immigrants from the Azores In Labor Force | Age > 16 Correlation Chart
The statistical analysis conducted on geographies consisting of 271,016,720 people shows a substantial negative correlation between the proportion of Immigrants from Ecuador and labor force participation rate among population ages 16 and over in the United States with a correlation coefficient (R) of -0.572 and weighted average of 65.7%. Similarly, the statistical analysis conducted on geographies consisting of 46,256,974 people shows a substantial negative correlation between the proportion of Immigrants from the Azores and labor force participation rate among population ages 16 and over in the United States with a correlation coefficient (R) of -0.582 and weighted average of 63.6%, a difference of 3.3%.
In Labor Force | Age > 16 Correlation Summary
| Measurement | Immigrants from Ecuador | Immigrants from the Azores |
| Minimum | 40.6% | 54.1% |
| Maximum | 75.0% | 73.8% |
| Range | 34.4% | 19.7% |
| Mean | 65.8% | 63.1% |
| Median | 66.6% | 63.7% |
| Interquartile 25% (IQ1) | 63.9% | 60.6% |
| Interquartile 75% (IQ3) | 68.4% | 65.3% |
| Interquartile Range (IQR) | 4.4% | 4.7% |
| Standard Deviation (Sample) | 5.7% | 4.3% |
| Standard Deviation (Population) | 5.7% | 4.2% |
Similar Demographics by In Labor Force | Age > 16
Demographics Similar to Immigrants from Ecuador by In Labor Force | Age > 16
In terms of in labor force | age > 16, the demographic groups most similar to Immigrants from Ecuador are New Zealander (65.7%, a difference of 0.010%), Immigrants from Hong Kong (65.7%, a difference of 0.020%), Immigrants from Iraq (65.7%, a difference of 0.030%), Iraqi (65.7%, a difference of 0.030%), and Immigrants from France (65.7%, a difference of 0.040%).
| Demographics | Rating | Rank | In Labor Force | Age > 16 |
| Immigrants | Indonesia | 96.8 /100 | #115 | Exceptional 65.7% |
| Argentineans | 96.7 /100 | #116 | Exceptional 65.7% |
| Immigrants | Iran | 96.6 /100 | #117 | Exceptional 65.7% |
| Immigrants | Thailand | 96.6 /100 | #118 | Exceptional 65.7% |
| Immigrants | France | 96.4 /100 | #119 | Exceptional 65.7% |
| Immigrants | Hong Kong | 96.2 /100 | #120 | Exceptional 65.7% |
| New Zealanders | 96.0 /100 | #121 | Exceptional 65.7% |
| Immigrants | Ecuador | 95.9 /100 | #122 | Exceptional 65.7% |
| Immigrants | Iraq | 95.5 /100 | #123 | Exceptional 65.7% |
| Iraqis | 95.4 /100 | #124 | Exceptional 65.7% |
| Norwegians | 95.3 /100 | #125 | Exceptional 65.7% |
| Koreans | 95.3 /100 | #126 | Exceptional 65.7% |
| Immigrants | Eastern Asia | 94.9 /100 | #127 | Exceptional 65.7% |
| Ecuadorians | 94.7 /100 | #128 | Exceptional 65.6% |
| Immigrants | Philippines | 94.5 /100 | #129 | Exceptional 65.6% |
Demographics Similar to Immigrants from the Azores by In Labor Force | Age > 16
In terms of in labor force | age > 16, the demographic groups most similar to Immigrants from the Azores are White/Caucasian (63.6%, a difference of 0.010%), Spanish American (63.6%, a difference of 0.030%), Delaware (63.6%, a difference of 0.040%), Comanche (63.6%, a difference of 0.060%), and Immigrants from Grenada (63.6%, a difference of 0.070%).
| Demographics | Rating | Rank | In Labor Force | Age > 16 |
| English | 0.1 /100 | #293 | Tragic 63.7% |
| Puget Sound Salish | 0.0 /100 | #294 | Tragic 63.7% |
| Immigrants | Canada | 0.0 /100 | #295 | Tragic 63.7% |
| Immigrants | North America | 0.0 /100 | #296 | Tragic 63.7% |
| Immigrants | Grenada | 0.0 /100 | #297 | Tragic 63.6% |
| Comanche | 0.0 /100 | #298 | Tragic 63.6% |
| Whites/Caucasians | 0.0 /100 | #299 | Tragic 63.6% |
| Immigrants | Azores | 0.0 /100 | #300 | Tragic 63.6% |
| Spanish Americans | 0.0 /100 | #301 | Tragic 63.6% |
| Delaware | 0.0 /100 | #302 | Tragic 63.6% |
| Cree | 0.0 /100 | #303 | Tragic 63.5% |
| Immigrants | Nonimmigrants | 0.0 /100 | #304 | Tragic 63.5% |
| Osage | 0.0 /100 | #305 | Tragic 63.5% |
| Blacks/African Americans | 0.0 /100 | #306 | Tragic 63.4% |
| Central American Indians | 0.0 /100 | #307 | Tragic 63.4% |