European vs Immigrants from the Azores Doctorate Degree
COMPARE
European
Immigrants from the Azores
Doctorate Degree
Doctorate Degree Comparison
Europeans
Immigrants from the Azores
2.1%
DOCTORATE DEGREE
97.5/ 100
METRIC RATING
107th/ 347
METRIC RANK
1.4%
DOCTORATE DEGREE
0.1/ 100
METRIC RATING
315th/ 347
METRIC RANK
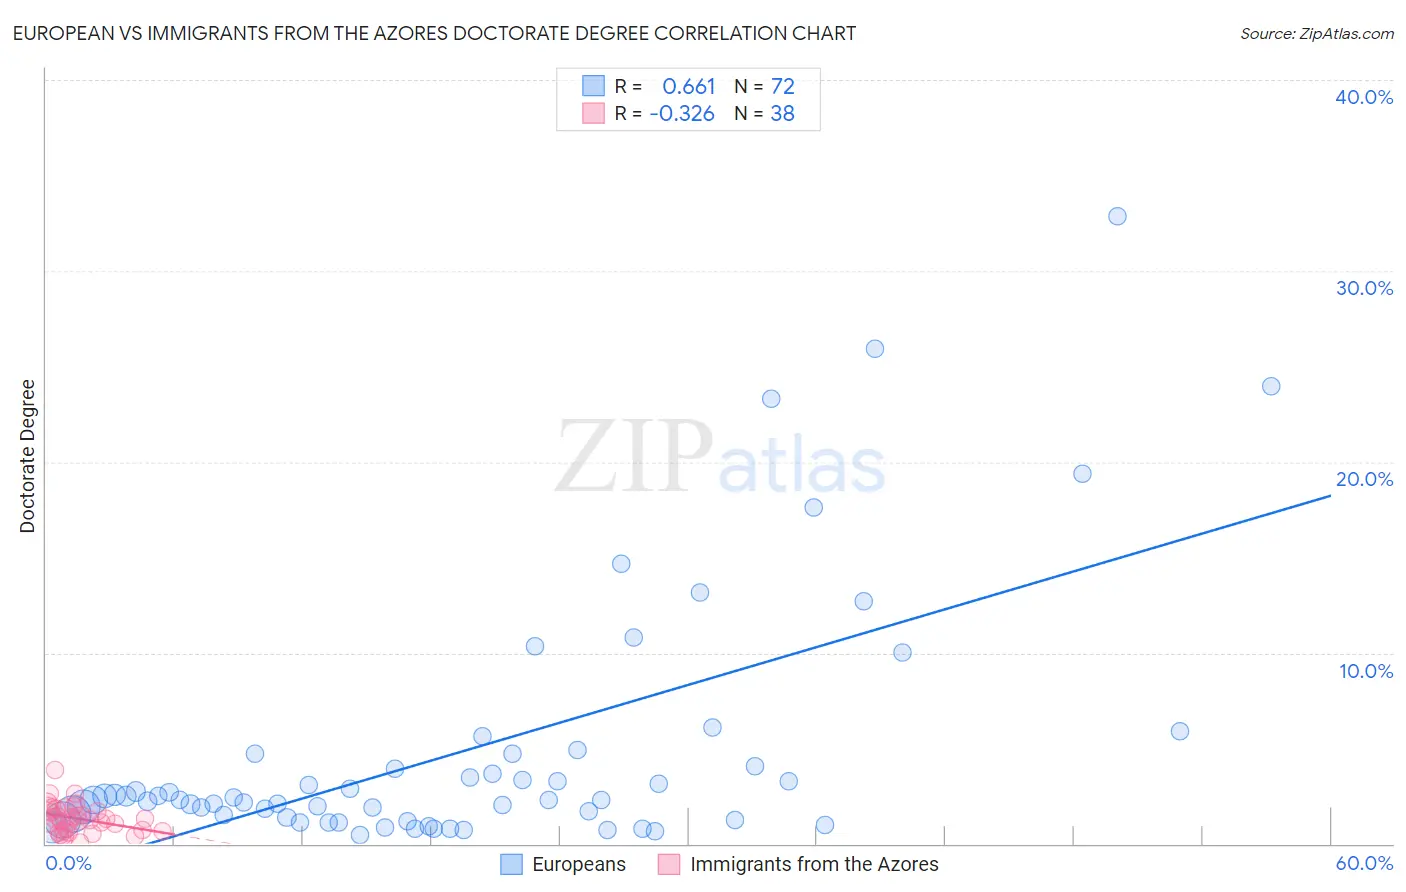
European vs Immigrants from the Azores Doctorate Degree Correlation Chart
The statistical analysis conducted on geographies consisting of 540,466,833 people shows a significant positive correlation between the proportion of Europeans and percentage of population with at least doctorate degree education in the United States with a correlation coefficient (R) of 0.661 and weighted average of 2.1%. Similarly, the statistical analysis conducted on geographies consisting of 46,011,350 people shows a mild negative correlation between the proportion of Immigrants from the Azores and percentage of population with at least doctorate degree education in the United States with a correlation coefficient (R) of -0.326 and weighted average of 1.4%, a difference of 54.0%.
Doctorate Degree Correlation Summary
| Measurement | European | Immigrants from the Azores |
| Minimum | 0.48% | 0.085% |
| Maximum | 32.8% | 3.9% |
| Range | 32.4% | 3.8% |
| Mean | 4.9% | 1.3% |
| Median | 2.3% | 1.3% |
| Interquartile 25% (IQ1) | 1.3% | 0.68% |
| Interquartile 75% (IQ3) | 4.4% | 1.8% |
| Interquartile Range (IQR) | 3.1% | 1.1% |
| Standard Deviation (Sample) | 6.6% | 0.76% |
| Standard Deviation (Population) | 6.6% | 0.75% |
Similar Demographics by Doctorate Degree
Demographics Similar to Europeans by Doctorate Degree
In terms of doctorate degree, the demographic groups most similar to Europeans are Immigrants from Germany (2.1%, a difference of 0.22%), Ukrainian (2.1%, a difference of 0.28%), Brazilian (2.1%, a difference of 0.35%), Sudanese (2.1%, a difference of 0.39%), and Immigrants from Pakistan (2.1%, a difference of 0.41%).
| Demographics | Rating | Rank | Doctorate Degree |
| Immigrants | Eastern Europe | 98.2 /100 | #100 | Exceptional 2.1% |
| Immigrants | Eastern Africa | 98.2 /100 | #101 | Exceptional 2.1% |
| Immigrants | Chile | 98.1 /100 | #102 | Exceptional 2.1% |
| Romanians | 98.1 /100 | #103 | Exceptional 2.1% |
| Austrians | 98.0 /100 | #104 | Exceptional 2.1% |
| Arabs | 97.8 /100 | #105 | Exceptional 2.1% |
| Sudanese | 97.7 /100 | #106 | Exceptional 2.1% |
| Europeans | 97.5 /100 | #107 | Exceptional 2.1% |
| Immigrants | Germany | 97.3 /100 | #108 | Exceptional 2.1% |
| Ukrainians | 97.2 /100 | #109 | Exceptional 2.1% |
| Brazilians | 97.2 /100 | #110 | Exceptional 2.1% |
| Immigrants | Pakistan | 97.1 /100 | #111 | Exceptional 2.1% |
| Syrians | 97.1 /100 | #112 | Exceptional 2.1% |
| Immigrants | Italy | 96.9 /100 | #113 | Exceptional 2.1% |
| Immigrants | Croatia | 96.8 /100 | #114 | Exceptional 2.1% |
Demographics Similar to Immigrants from the Azores by Doctorate Degree
In terms of doctorate degree, the demographic groups most similar to Immigrants from the Azores are Dominican (1.4%, a difference of 0.020%), Menominee (1.4%, a difference of 0.10%), Navajo (1.4%, a difference of 0.21%), Immigrants from Nicaragua (1.4%, a difference of 0.42%), and Immigrants from Micronesia (1.3%, a difference of 0.45%).
| Demographics | Rating | Rank | Doctorate Degree |
| Immigrants | Laos | 0.1 /100 | #308 | Tragic 1.4% |
| Immigrants | Grenada | 0.1 /100 | #309 | Tragic 1.4% |
| Immigrants | Jamaica | 0.1 /100 | #310 | Tragic 1.4% |
| Immigrants | Honduras | 0.1 /100 | #311 | Tragic 1.4% |
| Immigrants | Nicaragua | 0.1 /100 | #312 | Tragic 1.4% |
| Menominee | 0.1 /100 | #313 | Tragic 1.4% |
| Dominicans | 0.1 /100 | #314 | Tragic 1.4% |
| Immigrants | Azores | 0.1 /100 | #315 | Tragic 1.4% |
| Navajo | 0.1 /100 | #316 | Tragic 1.4% |
| Immigrants | Micronesia | 0.1 /100 | #317 | Tragic 1.3% |
| Creek | 0.1 /100 | #318 | Tragic 1.3% |
| Immigrants | Guyana | 0.1 /100 | #319 | Tragic 1.3% |
| Immigrants | St. Vincent and the Grenadines | 0.1 /100 | #320 | Tragic 1.3% |
| Dutch West Indians | 0.1 /100 | #321 | Tragic 1.3% |
| Seminole | 0.1 /100 | #322 | Tragic 1.3% |