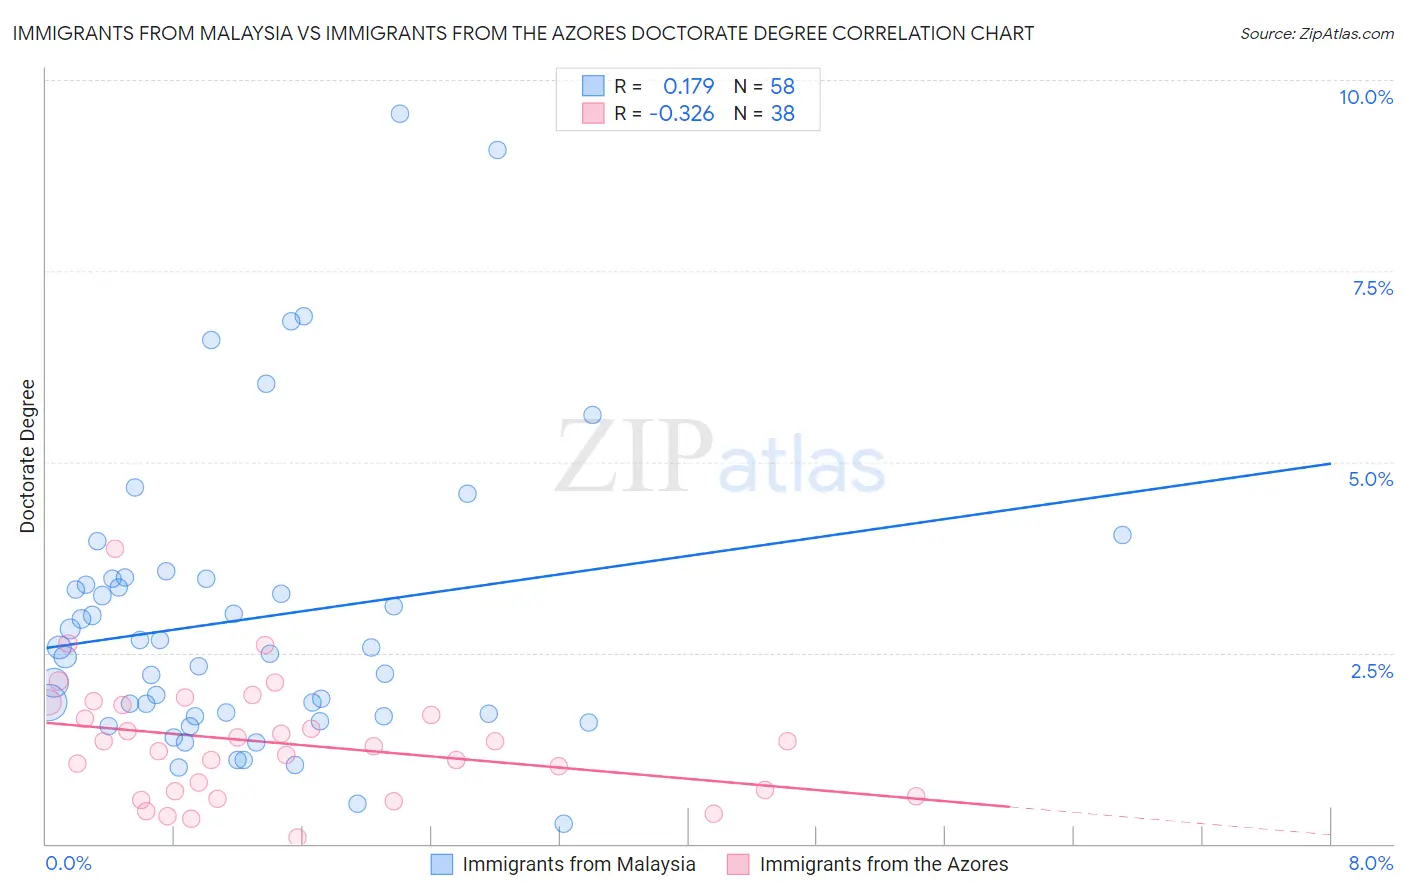
Immigrants from Malaysia vs Immigrants from the Azores Doctorate Degree
COMPARE
Immigrants from Malaysia
Immigrants from the Azores
Doctorate Degree
Doctorate Degree Comparison
Immigrants from Malaysia
Immigrants from the Azores
2.6%
DOCTORATE DEGREE
100.0/ 100
METRIC RATING
35th/ 347
METRIC RANK
1.4%
DOCTORATE DEGREE
0.1/ 100
METRIC RATING
315th/ 347
METRIC RANK
Immigrants from Malaysia vs Immigrants from the Azores Doctorate Degree Correlation Chart
The statistical analysis conducted on geographies consisting of 197,613,478 people shows a poor positive correlation between the proportion of Immigrants from Malaysia and percentage of population with at least doctorate degree education in the United States with a correlation coefficient (R) of 0.179 and weighted average of 2.6%. Similarly, the statistical analysis conducted on geographies consisting of 46,011,350 people shows a mild negative correlation between the proportion of Immigrants from the Azores and percentage of population with at least doctorate degree education in the United States with a correlation coefficient (R) of -0.326 and weighted average of 1.4%, a difference of 89.4%.
Doctorate Degree Correlation Summary
| Measurement | Immigrants from Malaysia | Immigrants from the Azores |
| Minimum | 0.26% | 0.085% |
| Maximum | 9.6% | 3.9% |
| Range | 9.3% | 3.8% |
| Mean | 2.9% | 1.3% |
| Median | 2.5% | 1.3% |
| Interquartile 25% (IQ1) | 1.7% | 0.68% |
| Interquartile 75% (IQ3) | 3.5% | 1.8% |
| Interquartile Range (IQR) | 1.8% | 1.1% |
| Standard Deviation (Sample) | 1.9% | 0.76% |
| Standard Deviation (Population) | 1.9% | 0.75% |
Similar Demographics by Doctorate Degree
Demographics Similar to Immigrants from Malaysia by Doctorate Degree
In terms of doctorate degree, the demographic groups most similar to Immigrants from Malaysia are Cypriot (2.6%, a difference of 0.060%), Immigrants from Spain (2.6%, a difference of 0.060%), Cambodian (2.6%, a difference of 0.17%), Immigrants from Kuwait (2.6%, a difference of 0.32%), and Immigrants from Northern Europe (2.6%, a difference of 0.35%).
| Demographics | Rating | Rank | Doctorate Degree |
| Burmese | 100.0 /100 | #28 | Exceptional 2.6% |
| Immigrants | South Central Asia | 100.0 /100 | #29 | Exceptional 2.6% |
| Immigrants | Korea | 100.0 /100 | #30 | Exceptional 2.6% |
| Latvians | 100.0 /100 | #31 | Exceptional 2.6% |
| Immigrants | Northern Europe | 100.0 /100 | #32 | Exceptional 2.6% |
| Cambodians | 100.0 /100 | #33 | Exceptional 2.6% |
| Cypriots | 100.0 /100 | #34 | Exceptional 2.6% |
| Immigrants | Malaysia | 100.0 /100 | #35 | Exceptional 2.6% |
| Immigrants | Spain | 100.0 /100 | #36 | Exceptional 2.6% |
| Immigrants | Kuwait | 100.0 /100 | #37 | Exceptional 2.6% |
| Russians | 100.0 /100 | #38 | Exceptional 2.6% |
| Immigrants | Ireland | 100.0 /100 | #39 | Exceptional 2.5% |
| Estonians | 100.0 /100 | #40 | Exceptional 2.5% |
| Immigrants | Russia | 100.0 /100 | #41 | Exceptional 2.5% |
| New Zealanders | 100.0 /100 | #42 | Exceptional 2.5% |
Demographics Similar to Immigrants from the Azores by Doctorate Degree
In terms of doctorate degree, the demographic groups most similar to Immigrants from the Azores are Dominican (1.4%, a difference of 0.020%), Menominee (1.4%, a difference of 0.10%), Navajo (1.4%, a difference of 0.21%), Immigrants from Nicaragua (1.4%, a difference of 0.42%), and Immigrants from Micronesia (1.3%, a difference of 0.45%).
| Demographics | Rating | Rank | Doctorate Degree |
| Immigrants | Laos | 0.1 /100 | #308 | Tragic 1.4% |
| Immigrants | Grenada | 0.1 /100 | #309 | Tragic 1.4% |
| Immigrants | Jamaica | 0.1 /100 | #310 | Tragic 1.4% |
| Immigrants | Honduras | 0.1 /100 | #311 | Tragic 1.4% |
| Immigrants | Nicaragua | 0.1 /100 | #312 | Tragic 1.4% |
| Menominee | 0.1 /100 | #313 | Tragic 1.4% |
| Dominicans | 0.1 /100 | #314 | Tragic 1.4% |
| Immigrants | Azores | 0.1 /100 | #315 | Tragic 1.4% |
| Navajo | 0.1 /100 | #316 | Tragic 1.4% |
| Immigrants | Micronesia | 0.1 /100 | #317 | Tragic 1.3% |
| Creek | 0.1 /100 | #318 | Tragic 1.3% |
| Immigrants | Guyana | 0.1 /100 | #319 | Tragic 1.3% |
| Immigrants | St. Vincent and the Grenadines | 0.1 /100 | #320 | Tragic 1.3% |
| Dutch West Indians | 0.1 /100 | #321 | Tragic 1.3% |
| Seminole | 0.1 /100 | #322 | Tragic 1.3% |