Immigrants from Eastern Asia vs Immigrants from West Indies 12th Grade, No Diploma
COMPARE
Immigrants from Eastern Asia
Immigrants from West Indies
12th Grade, No Diploma
12th Grade, No Diploma Comparison
Immigrants from Eastern Asia
Immigrants from West Indies
91.8%
12TH GRADE, NO DIPLOMA
89.3/ 100
METRIC RATING
132nd/ 347
METRIC RANK
88.6%
12TH GRADE, NO DIPLOMA
0.0/ 100
METRIC RATING
286th/ 347
METRIC RANK
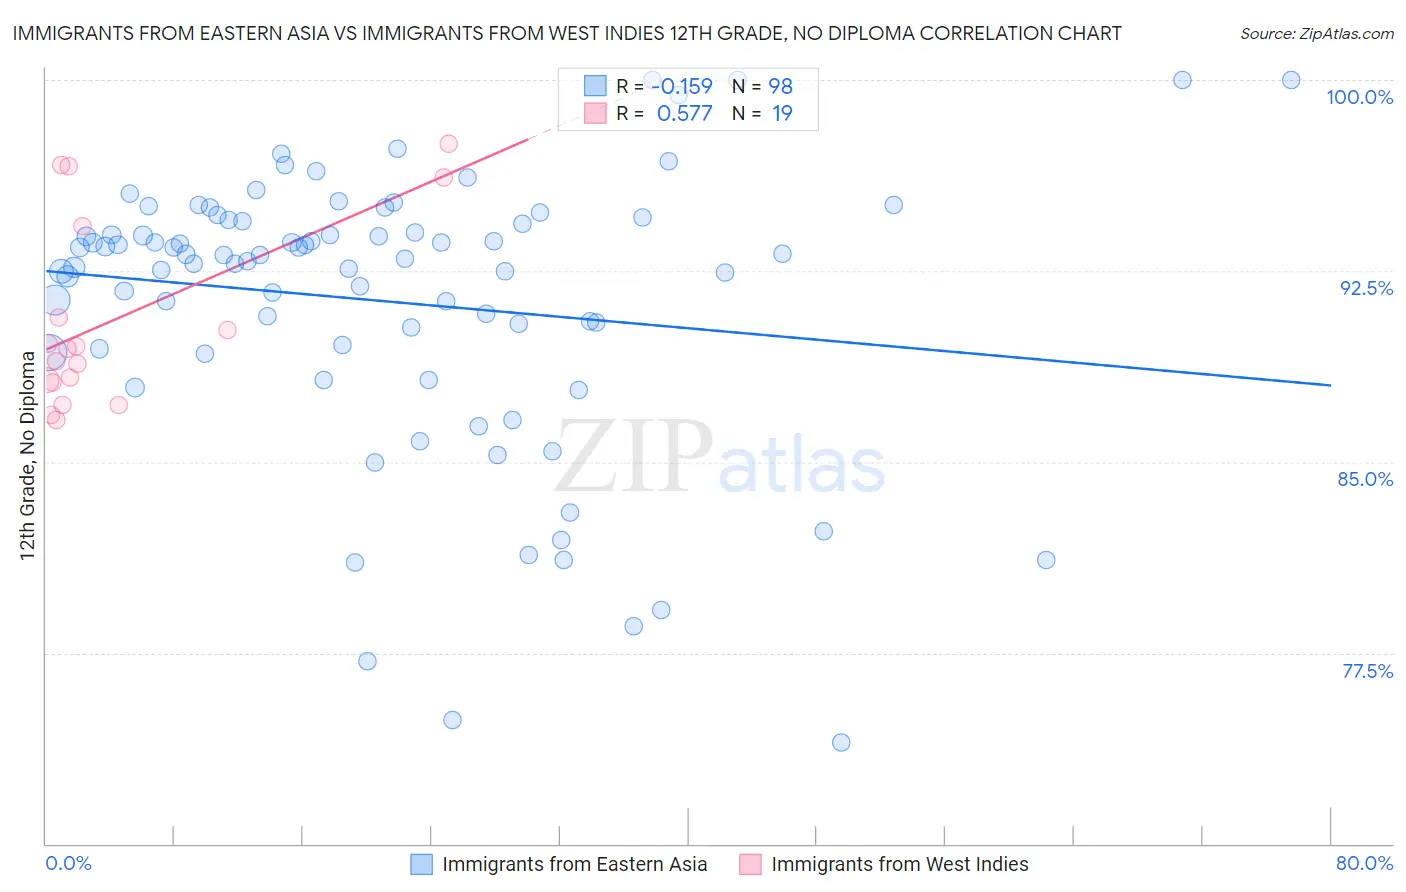
Immigrants from Eastern Asia vs Immigrants from West Indies 12th Grade, No Diploma Correlation Chart
The statistical analysis conducted on geographies consisting of 499,846,284 people shows a poor negative correlation between the proportion of Immigrants from Eastern Asia and percentage of population with at least 12th grade (no diploma) education in the United States with a correlation coefficient (R) of -0.159 and weighted average of 91.8%. Similarly, the statistical analysis conducted on geographies consisting of 72,457,514 people shows a substantial positive correlation between the proportion of Immigrants from West Indies and percentage of population with at least 12th grade (no diploma) education in the United States with a correlation coefficient (R) of 0.577 and weighted average of 88.6%, a difference of 3.5%.
12th Grade, No Diploma Correlation Summary
| Measurement | Immigrants from Eastern Asia | Immigrants from West Indies |
| Minimum | 74.0% | 86.7% |
| Maximum | 100.0% | 97.5% |
| Range | 26.0% | 10.8% |
| Mean | 91.3% | 90.6% |
| Median | 93.1% | 89.4% |
| Interquartile 25% (IQ1) | 89.5% | 88.1% |
| Interquartile 75% (IQ3) | 94.4% | 94.3% |
| Interquartile Range (IQR) | 5.0% | 6.2% |
| Standard Deviation (Sample) | 5.4% | 3.7% |
| Standard Deviation (Population) | 5.4% | 3.6% |
Similar Demographics by 12th Grade, No Diploma
Demographics Similar to Immigrants from Eastern Asia by 12th Grade, No Diploma
In terms of 12th grade, no diploma, the demographic groups most similar to Immigrants from Eastern Asia are Albanian (91.8%, a difference of 0.0%), Assyrian/Chaldean/Syriac (91.8%, a difference of 0.010%), Mongolian (91.8%, a difference of 0.020%), German Russian (91.8%, a difference of 0.020%), and Immigrants from Italy (91.7%, a difference of 0.030%).
| Demographics | Rating | Rank | 12th Grade, No Diploma |
| Whites/Caucasians | 91.6 /100 | #125 | Exceptional 91.8% |
| Basques | 91.3 /100 | #126 | Exceptional 91.8% |
| Immigrants | Jordan | 91.0 /100 | #127 | Exceptional 91.8% |
| Mongolians | 89.9 /100 | #128 | Excellent 91.8% |
| German Russians | 89.8 /100 | #129 | Excellent 91.8% |
| Assyrians/Chaldeans/Syriacs | 89.6 /100 | #130 | Excellent 91.8% |
| Albanians | 89.3 /100 | #131 | Excellent 91.8% |
| Immigrants | Eastern Asia | 89.3 /100 | #132 | Excellent 91.8% |
| Immigrants | Italy | 88.3 /100 | #133 | Excellent 91.7% |
| Venezuelans | 88.2 /100 | #134 | Excellent 91.7% |
| Immigrants | Bosnia and Herzegovina | 87.3 /100 | #135 | Excellent 91.7% |
| Chileans | 85.8 /100 | #136 | Excellent 91.7% |
| Alaska Natives | 84.9 /100 | #137 | Excellent 91.6% |
| Arabs | 84.1 /100 | #138 | Excellent 91.6% |
| Immigrants | Egypt | 83.9 /100 | #139 | Excellent 91.6% |
Demographics Similar to Immigrants from West Indies by 12th Grade, No Diploma
In terms of 12th grade, no diploma, the demographic groups most similar to Immigrants from West Indies are Indonesian (88.6%, a difference of 0.0%), Hopi (88.6%, a difference of 0.010%), Immigrants from Fiji (88.6%, a difference of 0.010%), Pennsylvania German (88.7%, a difference of 0.020%), and Paiute (88.7%, a difference of 0.030%).
| Demographics | Rating | Rank | 12th Grade, No Diploma |
| Immigrants | Laos | 0.0 /100 | #279 | Tragic 88.9% |
| Immigrants | Burma/Myanmar | 0.0 /100 | #280 | Tragic 88.9% |
| Cubans | 0.0 /100 | #281 | Tragic 88.9% |
| Immigrants | Vietnam | 0.0 /100 | #282 | Tragic 88.7% |
| Paiute | 0.0 /100 | #283 | Tragic 88.7% |
| Pennsylvania Germans | 0.0 /100 | #284 | Tragic 88.7% |
| Indonesians | 0.0 /100 | #285 | Tragic 88.6% |
| Immigrants | West Indies | 0.0 /100 | #286 | Tragic 88.6% |
| Hopi | 0.0 /100 | #287 | Tragic 88.6% |
| Immigrants | Fiji | 0.0 /100 | #288 | Tragic 88.6% |
| Dutch West Indians | 0.0 /100 | #289 | Tragic 88.5% |
| British West Indians | 0.0 /100 | #290 | Tragic 88.5% |
| Haitians | 0.0 /100 | #291 | Tragic 88.5% |
| Immigrants | Grenada | 0.0 /100 | #292 | Tragic 88.4% |
| Japanese | 0.0 /100 | #293 | Tragic 88.3% |