Immigrants from Albania vs Laotian Bachelor's Degree
COMPARE
Immigrants from Albania
Laotian
Bachelor's Degree
Bachelor's Degree Comparison
Immigrants from Albania
Laotians
40.4%
BACHELOR'S DEGREE
94.4/ 100
METRIC RATING
122nd/ 347
METRIC RANK
42.0%
BACHELOR'S DEGREE
98.9/ 100
METRIC RATING
90th/ 347
METRIC RANK
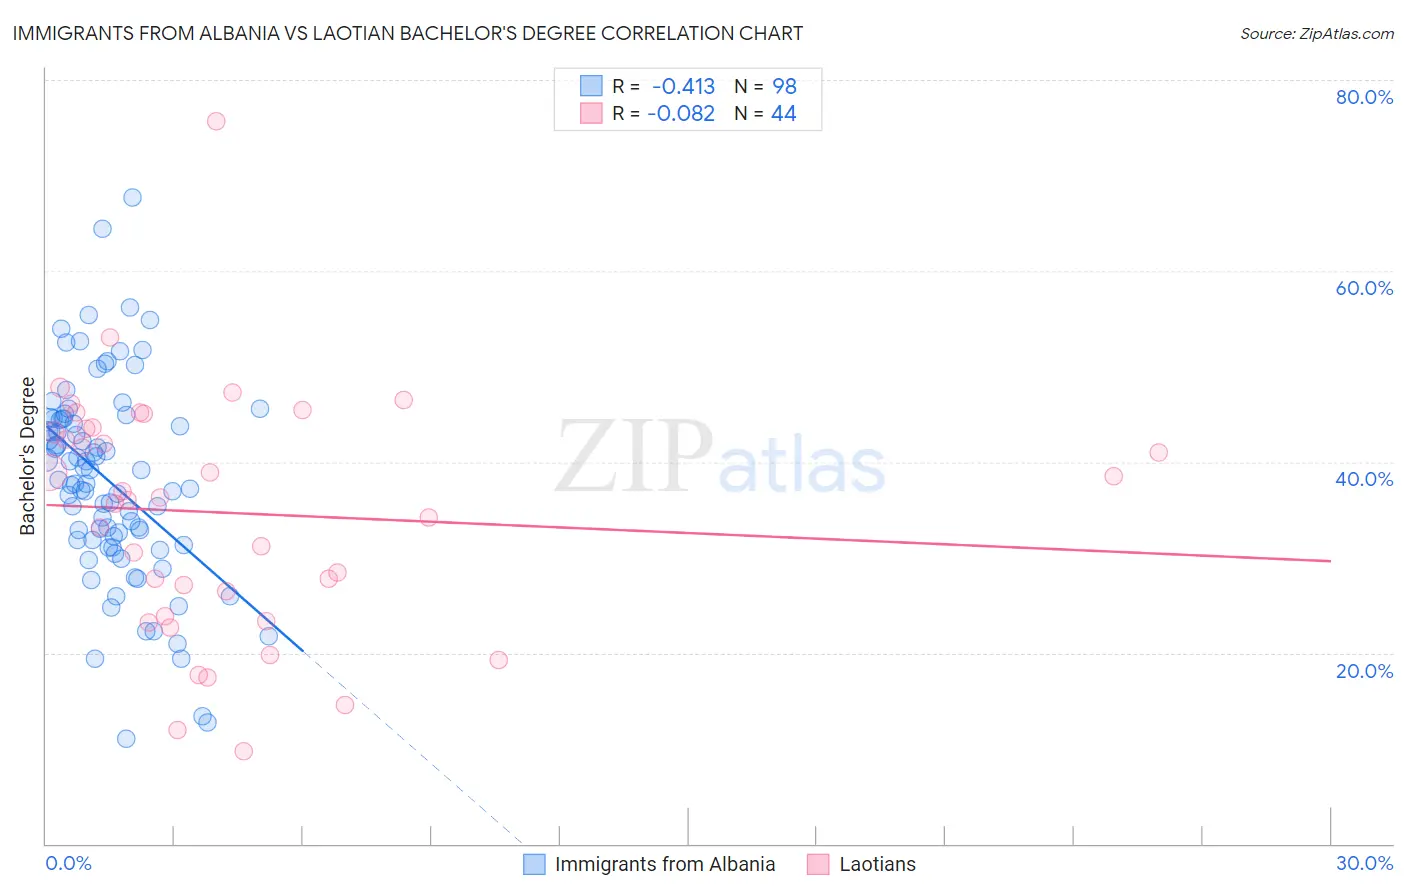
Immigrants from Albania vs Laotian Bachelor's Degree Correlation Chart
The statistical analysis conducted on geographies consisting of 119,391,185 people shows a moderate negative correlation between the proportion of Immigrants from Albania and percentage of population with at least bachelor's degree education in the United States with a correlation coefficient (R) of -0.413 and weighted average of 40.4%. Similarly, the statistical analysis conducted on geographies consisting of 224,838,887 people shows a slight negative correlation between the proportion of Laotians and percentage of population with at least bachelor's degree education in the United States with a correlation coefficient (R) of -0.082 and weighted average of 42.0%, a difference of 3.9%.
Bachelor's Degree Correlation Summary
| Measurement | Immigrants from Albania | Laotian |
| Minimum | 11.0% | 9.7% |
| Maximum | 67.7% | 75.7% |
| Range | 56.7% | 66.0% |
| Mean | 37.9% | 34.6% |
| Median | 37.9% | 36.1% |
| Interquartile 25% (IQ1) | 31.8% | 25.1% |
| Interquartile 75% (IQ3) | 44.5% | 43.5% |
| Interquartile Range (IQR) | 12.7% | 18.4% |
| Standard Deviation (Sample) | 10.4% | 12.7% |
| Standard Deviation (Population) | 10.4% | 12.6% |
Similar Demographics by Bachelor's Degree
Demographics Similar to Immigrants from Albania by Bachelor's Degree
In terms of bachelor's degree, the demographic groups most similar to Immigrants from Albania are Lebanese (40.4%, a difference of 0.020%), Immigrants from Eritrea (40.4%, a difference of 0.020%), British (40.4%, a difference of 0.060%), Moroccan (40.5%, a difference of 0.10%), and Immigrants from Eastern Africa (40.4%, a difference of 0.10%).
| Demographics | Rating | Rank | Bachelor's Degree |
| Palestinians | 95.8 /100 | #115 | Exceptional 40.7% |
| Immigrants | Uganda | 95.7 /100 | #116 | Exceptional 40.7% |
| Austrians | 95.5 /100 | #117 | Exceptional 40.6% |
| Croatians | 95.5 /100 | #118 | Exceptional 40.6% |
| Immigrants | Syria | 94.9 /100 | #119 | Exceptional 40.5% |
| Venezuelans | 94.7 /100 | #120 | Exceptional 40.5% |
| Moroccans | 94.6 /100 | #121 | Exceptional 40.5% |
| Immigrants | Albania | 94.4 /100 | #122 | Exceptional 40.4% |
| Lebanese | 94.3 /100 | #123 | Exceptional 40.4% |
| Immigrants | Eritrea | 94.3 /100 | #124 | Exceptional 40.4% |
| British | 94.2 /100 | #125 | Exceptional 40.4% |
| Immigrants | Eastern Africa | 94.1 /100 | #126 | Exceptional 40.4% |
| Immigrants | Jordan | 93.4 /100 | #127 | Exceptional 40.3% |
| Immigrants | Venezuela | 92.9 /100 | #128 | Exceptional 40.2% |
| Serbians | 92.4 /100 | #129 | Exceptional 40.1% |
Demographics Similar to Laotians by Bachelor's Degree
In terms of bachelor's degree, the demographic groups most similar to Laotians are Immigrants from Northern Africa (41.9%, a difference of 0.10%), Greek (42.0%, a difference of 0.12%), Immigrants from Western Europe (42.0%, a difference of 0.13%), Maltese (41.9%, a difference of 0.17%), and Carpatho Rusyn (42.1%, a difference of 0.25%).
| Demographics | Rating | Rank | Bachelor's Degree |
| Armenians | 99.2 /100 | #83 | Exceptional 42.3% |
| Immigrants | Western Asia | 99.2 /100 | #84 | Exceptional 42.3% |
| Lithuanians | 99.2 /100 | #85 | Exceptional 42.2% |
| Immigrants | Brazil | 99.2 /100 | #86 | Exceptional 42.2% |
| Carpatho Rusyns | 99.0 /100 | #87 | Exceptional 42.1% |
| Immigrants | Western Europe | 99.0 /100 | #88 | Exceptional 42.0% |
| Greeks | 99.0 /100 | #89 | Exceptional 42.0% |
| Laotians | 98.9 /100 | #90 | Exceptional 42.0% |
| Immigrants | Northern Africa | 98.9 /100 | #91 | Exceptional 41.9% |
| Maltese | 98.8 /100 | #92 | Exceptional 41.9% |
| Immigrants | Canada | 98.6 /100 | #93 | Exceptional 41.7% |
| Immigrants | Nepal | 98.6 /100 | #94 | Exceptional 41.7% |
| Immigrants | North America | 98.5 /100 | #95 | Exceptional 41.7% |
| Immigrants | Moldova | 98.4 /100 | #96 | Exceptional 41.6% |
| Romanians | 98.4 /100 | #97 | Exceptional 41.6% |