Immigrants from Dominican Republic vs Nepalese Bachelor's Degree
COMPARE
Immigrants from Dominican Republic
Nepalese
Bachelor's Degree
Bachelor's Degree Comparison
Immigrants from Dominican Republic
Nepalese
30.7%
BACHELOR'S DEGREE
0.0/ 100
METRIC RATING
295th/ 347
METRIC RANK
29.9%
BACHELOR'S DEGREE
0.0/ 100
METRIC RATING
307th/ 347
METRIC RANK
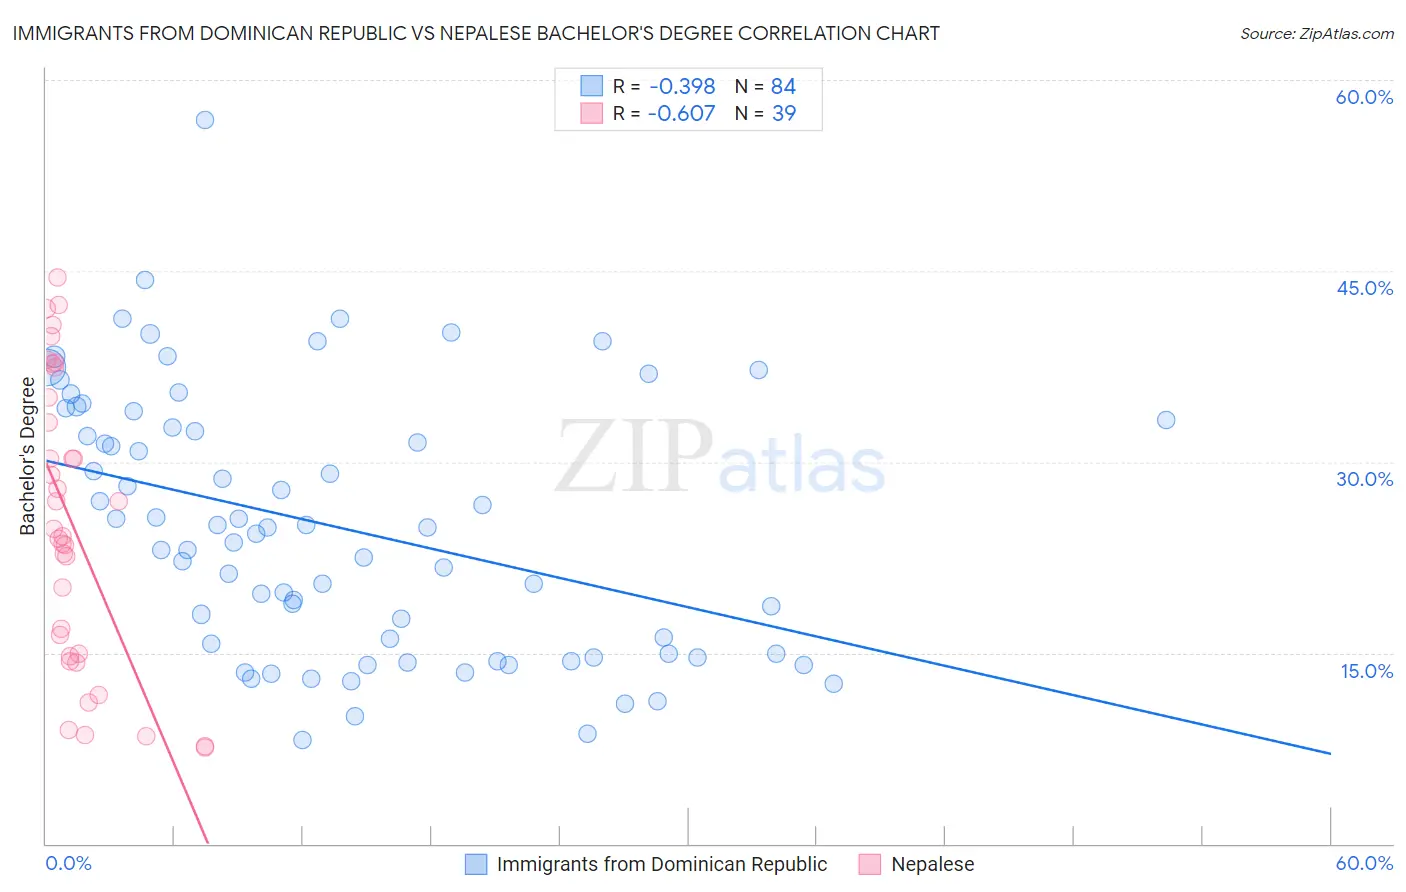
Immigrants from Dominican Republic vs Nepalese Bachelor's Degree Correlation Chart
The statistical analysis conducted on geographies consisting of 275,132,010 people shows a mild negative correlation between the proportion of Immigrants from Dominican Republic and percentage of population with at least bachelor's degree education in the United States with a correlation coefficient (R) of -0.398 and weighted average of 30.7%. Similarly, the statistical analysis conducted on geographies consisting of 24,519,269 people shows a significant negative correlation between the proportion of Nepalese and percentage of population with at least bachelor's degree education in the United States with a correlation coefficient (R) of -0.607 and weighted average of 29.9%, a difference of 2.6%.
Bachelor's Degree Correlation Summary
| Measurement | Immigrants from Dominican Republic | Nepalese |
| Minimum | 8.2% | 7.6% |
| Maximum | 56.8% | 44.5% |
| Range | 48.6% | 36.9% |
| Mean | 24.9% | 24.9% |
| Median | 24.6% | 24.2% |
| Interquartile 25% (IQ1) | 14.9% | 14.8% |
| Interquartile 75% (IQ3) | 33.0% | 35.1% |
| Interquartile Range (IQR) | 18.1% | 20.3% |
| Standard Deviation (Sample) | 10.2% | 11.2% |
| Standard Deviation (Population) | 10.1% | 11.0% |
Demographics Similar to Immigrants from Dominican Republic and Nepalese by Bachelor's Degree
In terms of bachelor's degree, the demographic groups most similar to Immigrants from Dominican Republic are Puget Sound Salish (30.7%, a difference of 0.10%), Immigrants from Haiti (30.6%, a difference of 0.16%), Immigrants from Guatemala (30.8%, a difference of 0.24%), Chippewa (30.6%, a difference of 0.41%), and Cape Verdean (30.9%, a difference of 0.63%). Similarly, the demographic groups most similar to Nepalese are Immigrants from Yemen (29.9%, a difference of 0.040%), Immigrants from Latin America (30.1%, a difference of 0.58%), Cajun (29.6%, a difference of 0.86%), Bangladeshi (30.2%, a difference of 1.0%), and Cherokee (30.2%, a difference of 1.0%).
| Demographics | Rating | Rank | Bachelor's Degree |
| Blacks/African Americans | 0.1 /100 | #291 | Tragic 30.9% |
| Ute | 0.1 /100 | #292 | Tragic 30.9% |
| Cape Verdeans | 0.1 /100 | #293 | Tragic 30.9% |
| Immigrants | Guatemala | 0.0 /100 | #294 | Tragic 30.8% |
| Immigrants | Dominican Republic | 0.0 /100 | #295 | Tragic 30.7% |
| Puget Sound Salish | 0.0 /100 | #296 | Tragic 30.7% |
| Immigrants | Haiti | 0.0 /100 | #297 | Tragic 30.6% |
| Chippewa | 0.0 /100 | #298 | Tragic 30.6% |
| Chickasaw | 0.0 /100 | #299 | Tragic 30.4% |
| Immigrants | Micronesia | 0.0 /100 | #300 | Tragic 30.4% |
| Immigrants | Cuba | 0.0 /100 | #301 | Tragic 30.3% |
| Mexican American Indians | 0.0 /100 | #302 | Tragic 30.2% |
| Bangladeshis | 0.0 /100 | #303 | Tragic 30.2% |
| Cherokee | 0.0 /100 | #304 | Tragic 30.2% |
| Immigrants | Latin America | 0.0 /100 | #305 | Tragic 30.1% |
| Immigrants | Yemen | 0.0 /100 | #306 | Tragic 29.9% |
| Nepalese | 0.0 /100 | #307 | Tragic 29.9% |
| Cajuns | 0.0 /100 | #308 | Tragic 29.6% |
| Hispanics or Latinos | 0.0 /100 | #309 | Tragic 29.6% |
| Cheyenne | 0.0 /100 | #310 | Tragic 29.4% |
| Choctaw | 0.0 /100 | #311 | Tragic 29.4% |