Immigrants from Dominica vs U.S. Virgin Islander College, 1 year or more
COMPARE
Immigrants from Dominica
U.S. Virgin Islander
College, 1 year or more
College, 1 year or more Comparison
Immigrants from Dominica
U.S. Virgin Islanders
52.5%
COLLEGE, 1 YEAR OR MORE
0.0/ 100
METRIC RATING
298th/ 347
METRIC RANK
54.8%
COLLEGE, 1 YEAR OR MORE
0.3/ 100
METRIC RATING
263rd/ 347
METRIC RANK
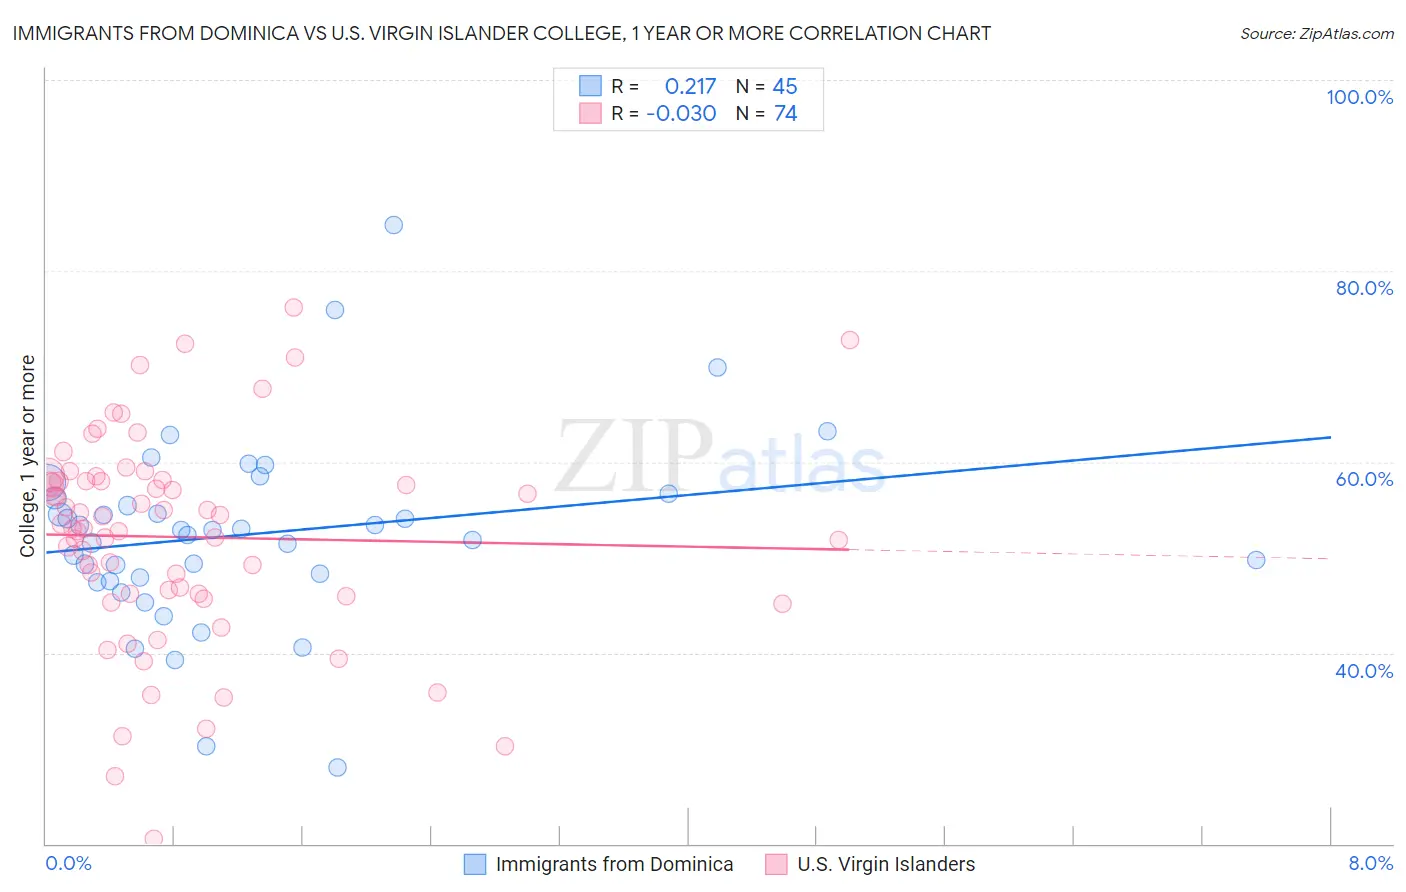
Immigrants from Dominica vs U.S. Virgin Islander College, 1 year or more Correlation Chart
The statistical analysis conducted on geographies consisting of 83,795,636 people shows a weak positive correlation between the proportion of Immigrants from Dominica and percentage of population with at least college, 1 year or more education in the United States with a correlation coefficient (R) of 0.217 and weighted average of 52.5%. Similarly, the statistical analysis conducted on geographies consisting of 87,526,675 people shows no correlation between the proportion of U.S. Virgin Islanders and percentage of population with at least college, 1 year or more education in the United States with a correlation coefficient (R) of -0.030 and weighted average of 54.8%, a difference of 4.3%.
College, 1 year or more Correlation Summary
| Measurement | Immigrants from Dominica | U.S. Virgin Islander |
| Minimum | 28.1% | 20.5% |
| Maximum | 84.8% | 76.2% |
| Range | 56.7% | 55.7% |
| Mean | 52.4% | 52.1% |
| Median | 52.8% | 53.3% |
| Interquartile 25% (IQ1) | 47.7% | 46.2% |
| Interquartile 75% (IQ3) | 56.4% | 58.0% |
| Interquartile Range (IQR) | 8.7% | 11.8% |
| Standard Deviation (Sample) | 10.0% | 10.9% |
| Standard Deviation (Population) | 9.9% | 10.8% |
Similar Demographics by College, 1 year or more
Demographics Similar to Immigrants from Dominica by College, 1 year or more
In terms of college, 1 year or more, the demographic groups most similar to Immigrants from Dominica are Immigrants from Nicaragua (52.4%, a difference of 0.34%), Choctaw (52.3%, a difference of 0.38%), Haitian (52.3%, a difference of 0.44%), Puerto Rican (52.2%, a difference of 0.57%), and Paiute (52.9%, a difference of 0.59%).
| Demographics | Rating | Rank | College, 1 year or more |
| Cubans | 0.0 /100 | #291 | Tragic 53.4% |
| Chickasaw | 0.0 /100 | #292 | Tragic 53.3% |
| Blacks/African Americans | 0.0 /100 | #293 | Tragic 53.3% |
| Cherokee | 0.0 /100 | #294 | Tragic 53.2% |
| Yaqui | 0.0 /100 | #295 | Tragic 53.2% |
| Sioux | 0.0 /100 | #296 | Tragic 53.0% |
| Paiute | 0.0 /100 | #297 | Tragic 52.9% |
| Immigrants | Dominica | 0.0 /100 | #298 | Tragic 52.5% |
| Immigrants | Nicaragua | 0.0 /100 | #299 | Tragic 52.4% |
| Choctaw | 0.0 /100 | #300 | Tragic 52.3% |
| Haitians | 0.0 /100 | #301 | Tragic 52.3% |
| Puerto Ricans | 0.0 /100 | #302 | Tragic 52.2% |
| Creek | 0.0 /100 | #303 | Tragic 52.2% |
| Central Americans | 0.0 /100 | #304 | Tragic 52.1% |
| Seminole | 0.0 /100 | #305 | Tragic 52.1% |
Demographics Similar to U.S. Virgin Islanders by College, 1 year or more
In terms of college, 1 year or more, the demographic groups most similar to U.S. Virgin Islanders are Immigrants from St. Vincent and the Grenadines (54.8%, a difference of 0.020%), Immigrants from Micronesia (54.8%, a difference of 0.020%), Ottawa (54.9%, a difference of 0.11%), Jamaican (54.9%, a difference of 0.13%), and Immigrants from Laos (54.7%, a difference of 0.22%).
| Demographics | Rating | Rank | College, 1 year or more |
| Immigrants | West Indies | 0.5 /100 | #256 | Tragic 55.2% |
| Indonesians | 0.4 /100 | #257 | Tragic 55.1% |
| Africans | 0.4 /100 | #258 | Tragic 55.0% |
| Nepalese | 0.3 /100 | #259 | Tragic 54.9% |
| Jamaicans | 0.3 /100 | #260 | Tragic 54.9% |
| Ottawa | 0.3 /100 | #261 | Tragic 54.9% |
| Immigrants | St. Vincent and the Grenadines | 0.3 /100 | #262 | Tragic 54.8% |
| U.S. Virgin Islanders | 0.3 /100 | #263 | Tragic 54.8% |
| Immigrants | Micronesia | 0.3 /100 | #264 | Tragic 54.8% |
| Immigrants | Laos | 0.2 /100 | #265 | Tragic 54.7% |
| Potawatomi | 0.2 /100 | #266 | Tragic 54.6% |
| Blackfeet | 0.2 /100 | #267 | Tragic 54.6% |
| British West Indians | 0.2 /100 | #268 | Tragic 54.5% |
| Bangladeshis | 0.2 /100 | #269 | Tragic 54.5% |
| Crow | 0.2 /100 | #270 | Tragic 54.5% |