Immigrants from Dominica vs Blackfeet Associate's Degree
COMPARE
Immigrants from Dominica
Blackfeet
Associate's Degree
Associate's Degree Comparison
Immigrants from Dominica
Blackfeet
40.5%
ASSOCIATE'S DEGREE
0.1/ 100
METRIC RATING
274th/ 347
METRIC RANK
40.3%
ASSOCIATE'S DEGREE
0.1/ 100
METRIC RATING
277th/ 347
METRIC RANK
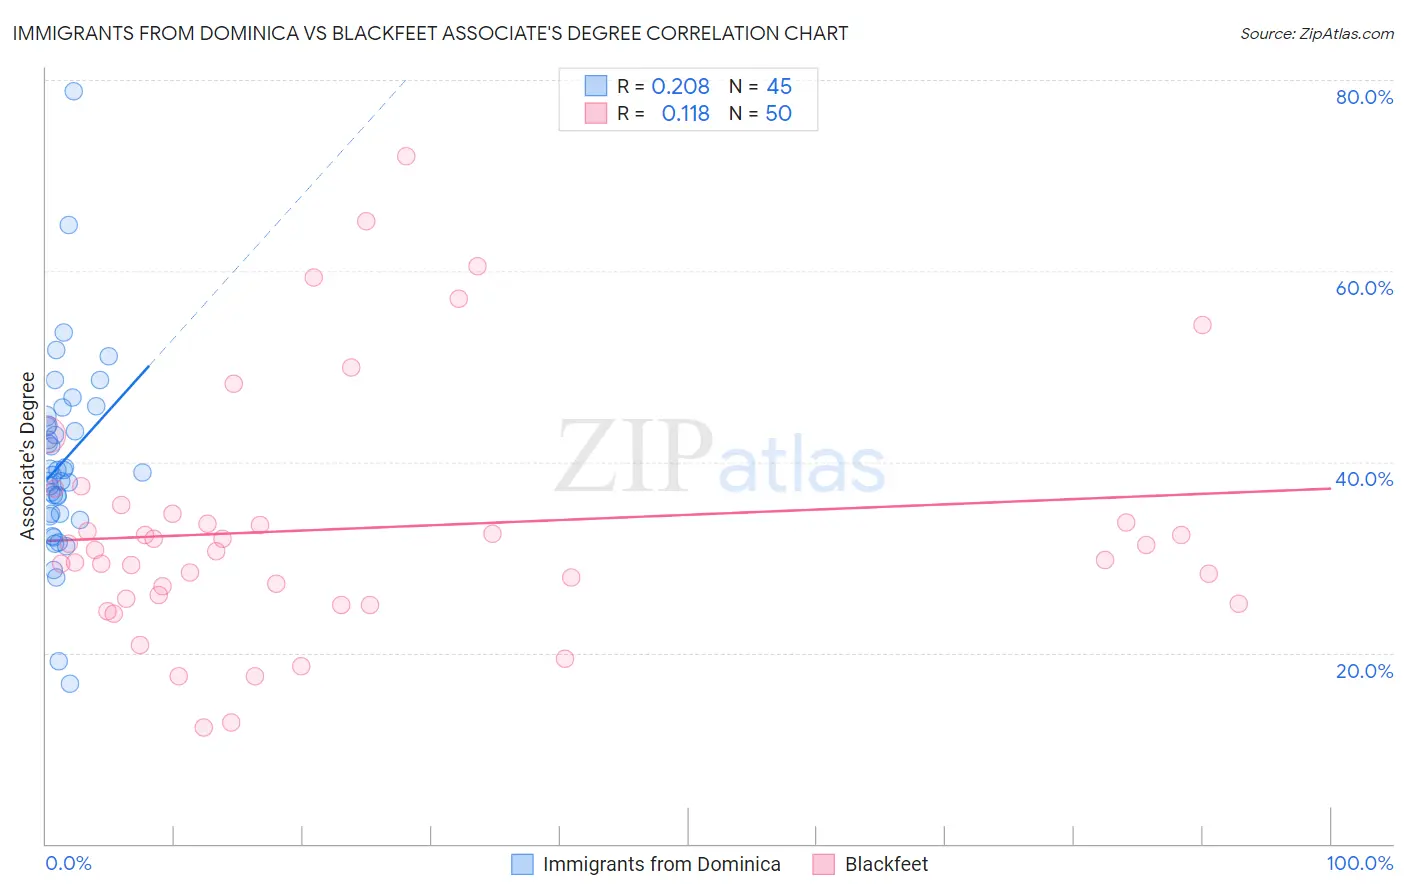
Immigrants from Dominica vs Blackfeet Associate's Degree Correlation Chart
The statistical analysis conducted on geographies consisting of 83,795,636 people shows a weak positive correlation between the proportion of Immigrants from Dominica and percentage of population with at least associate's degree education in the United States with a correlation coefficient (R) of 0.208 and weighted average of 40.5%. Similarly, the statistical analysis conducted on geographies consisting of 309,580,719 people shows a poor positive correlation between the proportion of Blackfeet and percentage of population with at least associate's degree education in the United States with a correlation coefficient (R) of 0.118 and weighted average of 40.3%, a difference of 0.30%.
Associate's Degree Correlation Summary
| Measurement | Immigrants from Dominica | Blackfeet |
| Minimum | 16.7% | 12.2% |
| Maximum | 78.8% | 72.0% |
| Range | 62.1% | 59.8% |
| Mean | 40.0% | 33.0% |
| Median | 38.9% | 30.7% |
| Interquartile 25% (IQ1) | 34.4% | 25.7% |
| Interquartile 75% (IQ3) | 44.3% | 34.5% |
| Interquartile Range (IQR) | 9.9% | 8.8% |
| Standard Deviation (Sample) | 10.3% | 13.0% |
| Standard Deviation (Population) | 10.2% | 12.8% |
Demographics Similar to Immigrants from Dominica and Blackfeet by Associate's Degree
In terms of associate's degree, the demographic groups most similar to Immigrants from Dominica are Puget Sound Salish (40.5%, a difference of 0.14%), Potawatomi (40.4%, a difference of 0.14%), Puerto Rican (40.4%, a difference of 0.25%), Belizean (40.6%, a difference of 0.43%), and Ottawa (40.3%, a difference of 0.44%). Similarly, the demographic groups most similar to Blackfeet are Puerto Rican (40.4%, a difference of 0.050%), Ottawa (40.3%, a difference of 0.15%), Potawatomi (40.4%, a difference of 0.16%), Immigrants from Nicaragua (40.3%, a difference of 0.19%), and Immigrants from Micronesia (40.2%, a difference of 0.39%).
| Demographics | Rating | Rank | Associate's Degree |
| Africans | 0.2 /100 | #265 | Tragic 41.1% |
| Samoans | 0.2 /100 | #266 | Tragic 41.1% |
| Hawaiians | 0.2 /100 | #267 | Tragic 40.9% |
| Central American Indians | 0.2 /100 | #268 | Tragic 40.8% |
| Americans | 0.2 /100 | #269 | Tragic 40.8% |
| Chippewa | 0.2 /100 | #270 | Tragic 40.7% |
| Immigrants | Laos | 0.1 /100 | #271 | Tragic 40.7% |
| Belizeans | 0.1 /100 | #272 | Tragic 40.6% |
| Puget Sound Salish | 0.1 /100 | #273 | Tragic 40.5% |
| Immigrants | Dominica | 0.1 /100 | #274 | Tragic 40.5% |
| Potawatomi | 0.1 /100 | #275 | Tragic 40.4% |
| Puerto Ricans | 0.1 /100 | #276 | Tragic 40.4% |
| Blackfeet | 0.1 /100 | #277 | Tragic 40.3% |
| Ottawa | 0.1 /100 | #278 | Tragic 40.3% |
| Immigrants | Nicaragua | 0.1 /100 | #279 | Tragic 40.3% |
| Immigrants | Micronesia | 0.1 /100 | #280 | Tragic 40.2% |
| Immigrants | Portugal | 0.1 /100 | #281 | Tragic 40.1% |
| Bangladeshis | 0.1 /100 | #282 | Tragic 40.0% |
| Haitians | 0.1 /100 | #283 | Tragic 40.0% |
| Comanche | 0.1 /100 | #284 | Tragic 39.9% |
| Immigrants | Belize | 0.1 /100 | #285 | Tragic 39.9% |