Immigrants from Dominica vs Immigrants from Morocco Unemployment Among Women with Children Under 6 years
COMPARE
Immigrants from Dominica
Immigrants from Morocco
Unemployment Among Women with Children Under 6 years
Unemployment Among Women with Children Under 6 years Comparison
Immigrants from Dominica
Immigrants from Morocco
8.6%
UNEMPLOYMENT AMONG WOMEN WITH CHILDREN UNDER 6 YEARS
0.0/ 100
METRIC RATING
278th/ 347
METRIC RANK
7.4%
UNEMPLOYMENT AMONG WOMEN WITH CHILDREN UNDER 6 YEARS
84.9/ 100
METRIC RATING
136th/ 347
METRIC RANK
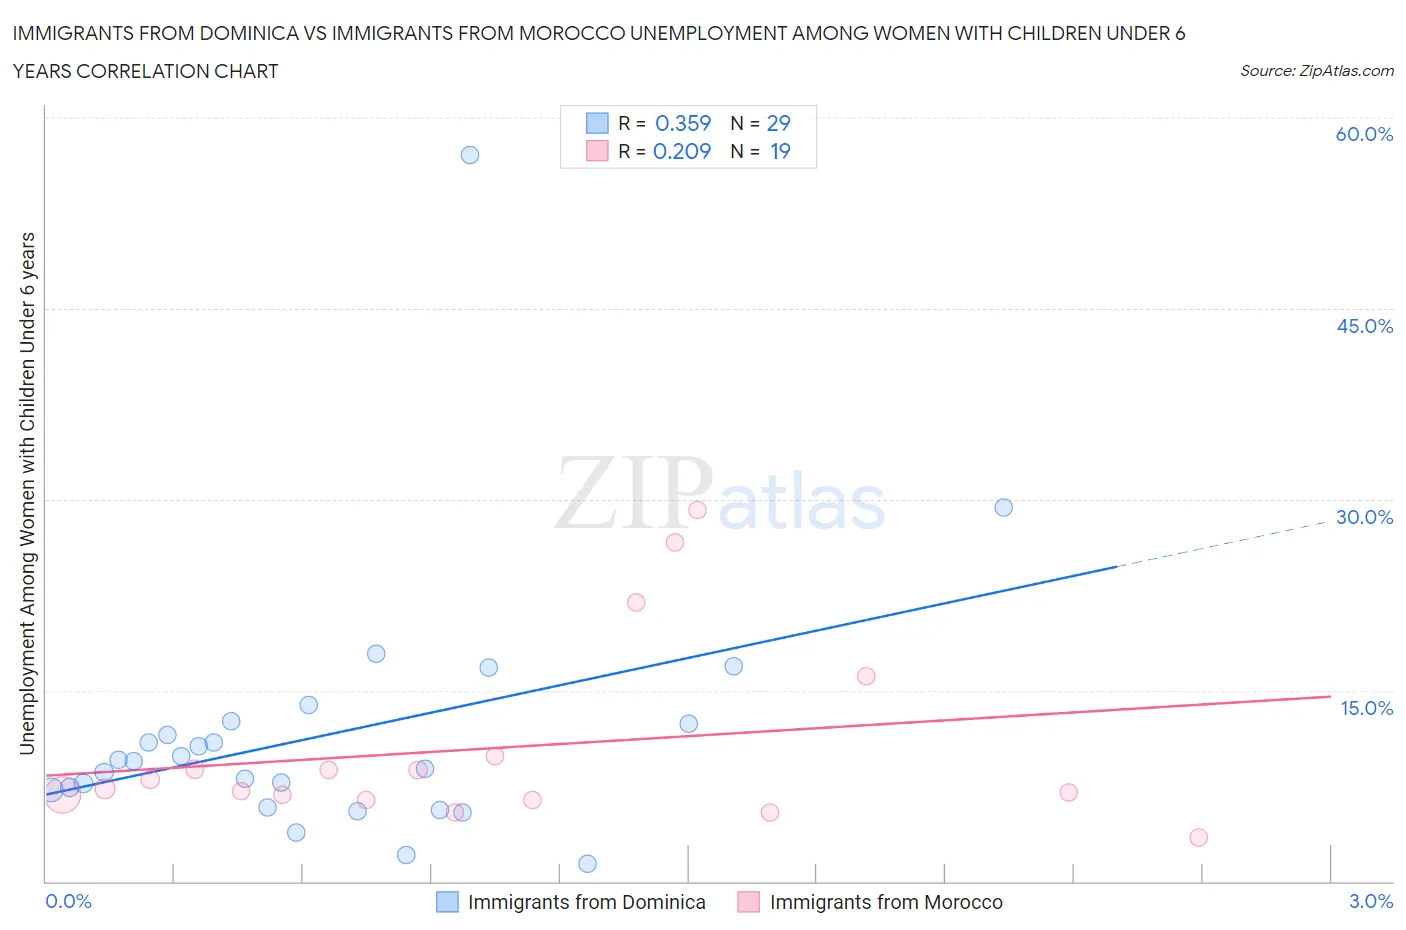
Immigrants from Dominica vs Immigrants from Morocco Unemployment Among Women with Children Under 6 years Correlation Chart
The statistical analysis conducted on geographies consisting of 77,270,473 people shows a mild positive correlation between the proportion of Immigrants from Dominica and unemployment rate among women with children under the age of 6 in the United States with a correlation coefficient (R) of 0.359 and weighted average of 8.6%. Similarly, the statistical analysis conducted on geographies consisting of 154,831,336 people shows a weak positive correlation between the proportion of Immigrants from Morocco and unemployment rate among women with children under the age of 6 in the United States with a correlation coefficient (R) of 0.209 and weighted average of 7.4%, a difference of 16.4%.
Unemployment Among Women with Children Under 6 years Correlation Summary
| Measurement | Immigrants from Dominica | Immigrants from Morocco |
| Minimum | 1.4% | 3.4% |
| Maximum | 57.1% | 29.2% |
| Range | 55.7% | 25.8% |
| Mean | 11.5% | 10.5% |
| Median | 9.4% | 7.2% |
| Interquartile 25% (IQ1) | 6.5% | 6.4% |
| Interquartile 75% (IQ3) | 12.5% | 9.8% |
| Interquartile Range (IQR) | 6.0% | 3.4% |
| Standard Deviation (Sample) | 10.4% | 7.4% |
| Standard Deviation (Population) | 10.2% | 7.2% |
Similar Demographics by Unemployment Among Women with Children Under 6 years
Demographics Similar to Immigrants from Dominica by Unemployment Among Women with Children Under 6 years
In terms of unemployment among women with children under 6 years, the demographic groups most similar to Immigrants from Dominica are Immigrants from Guatemala (8.6%, a difference of 0.010%), Immigrants from Belize (8.6%, a difference of 0.050%), Guatemalan (8.7%, a difference of 0.18%), Bermudan (8.7%, a difference of 0.27%), and Haitian (8.6%, a difference of 0.28%).
| Demographics | Rating | Rank | Unemployment Among Women with Children Under 6 years |
| Immigrants | Congo | 0.2 /100 | #271 | Tragic 8.5% |
| Mexican American Indians | 0.1 /100 | #272 | Tragic 8.5% |
| Slovaks | 0.1 /100 | #273 | Tragic 8.5% |
| Immigrants | Cameroon | 0.1 /100 | #274 | Tragic 8.6% |
| Immigrants | Latin America | 0.1 /100 | #275 | Tragic 8.6% |
| Yaqui | 0.0 /100 | #276 | Tragic 8.6% |
| Haitians | 0.0 /100 | #277 | Tragic 8.6% |
| Immigrants | Dominica | 0.0 /100 | #278 | Tragic 8.6% |
| Immigrants | Guatemala | 0.0 /100 | #279 | Tragic 8.6% |
| Immigrants | Belize | 0.0 /100 | #280 | Tragic 8.6% |
| Guatemalans | 0.0 /100 | #281 | Tragic 8.7% |
| Bermudans | 0.0 /100 | #282 | Tragic 8.7% |
| Spanish American Indians | 0.0 /100 | #283 | Tragic 8.7% |
| Blackfeet | 0.0 /100 | #284 | Tragic 8.7% |
| U.S. Virgin Islanders | 0.0 /100 | #285 | Tragic 8.7% |
Demographics Similar to Immigrants from Morocco by Unemployment Among Women with Children Under 6 years
In terms of unemployment among women with children under 6 years, the demographic groups most similar to Immigrants from Morocco are Immigrants from Cambodia (7.4%, a difference of 0.030%), Immigrants from Northern Africa (7.4%, a difference of 0.060%), Immigrants from Norway (7.4%, a difference of 0.11%), Immigrants from Bolivia (7.4%, a difference of 0.12%), and Immigrants from Colombia (7.4%, a difference of 0.13%).
| Demographics | Rating | Rank | Unemployment Among Women with Children Under 6 years |
| Slovenes | 89.2 /100 | #129 | Excellent 7.4% |
| Swedes | 88.4 /100 | #130 | Excellent 7.4% |
| Ukrainians | 88.2 /100 | #131 | Excellent 7.4% |
| Immigrants | Armenia | 87.4 /100 | #132 | Excellent 7.4% |
| Immigrants | Uganda | 86.5 /100 | #133 | Excellent 7.4% |
| Immigrants | Bolivia | 85.7 /100 | #134 | Excellent 7.4% |
| Immigrants | Northern Africa | 85.3 /100 | #135 | Excellent 7.4% |
| Immigrants | Morocco | 84.9 /100 | #136 | Excellent 7.4% |
| Immigrants | Cambodia | 84.6 /100 | #137 | Excellent 7.4% |
| Immigrants | Norway | 84.1 /100 | #138 | Excellent 7.4% |
| Immigrants | Colombia | 83.9 /100 | #139 | Excellent 7.4% |
| Scandinavians | 83.0 /100 | #140 | Excellent 7.4% |
| Greeks | 82.6 /100 | #141 | Excellent 7.4% |
| Immigrants | Argentina | 81.5 /100 | #142 | Excellent 7.5% |
| Koreans | 81.3 /100 | #143 | Excellent 7.5% |