Immigrants from Dominica vs Immigrants from Morocco Unemployment Among Ages 45 to 54 years
COMPARE
Immigrants from Dominica
Immigrants from Morocco
Unemployment Among Ages 45 to 54 years
Unemployment Among Ages 45 to 54 years Comparison
Immigrants from Dominica
Immigrants from Morocco
5.6%
UNEMPLOYMENT AMONG AGES 45 TO 54 YEARS
0.0/ 100
METRIC RATING
315th/ 347
METRIC RANK
4.6%
UNEMPLOYMENT AMONG AGES 45 TO 54 YEARS
16.8/ 100
METRIC RATING
204th/ 347
METRIC RANK
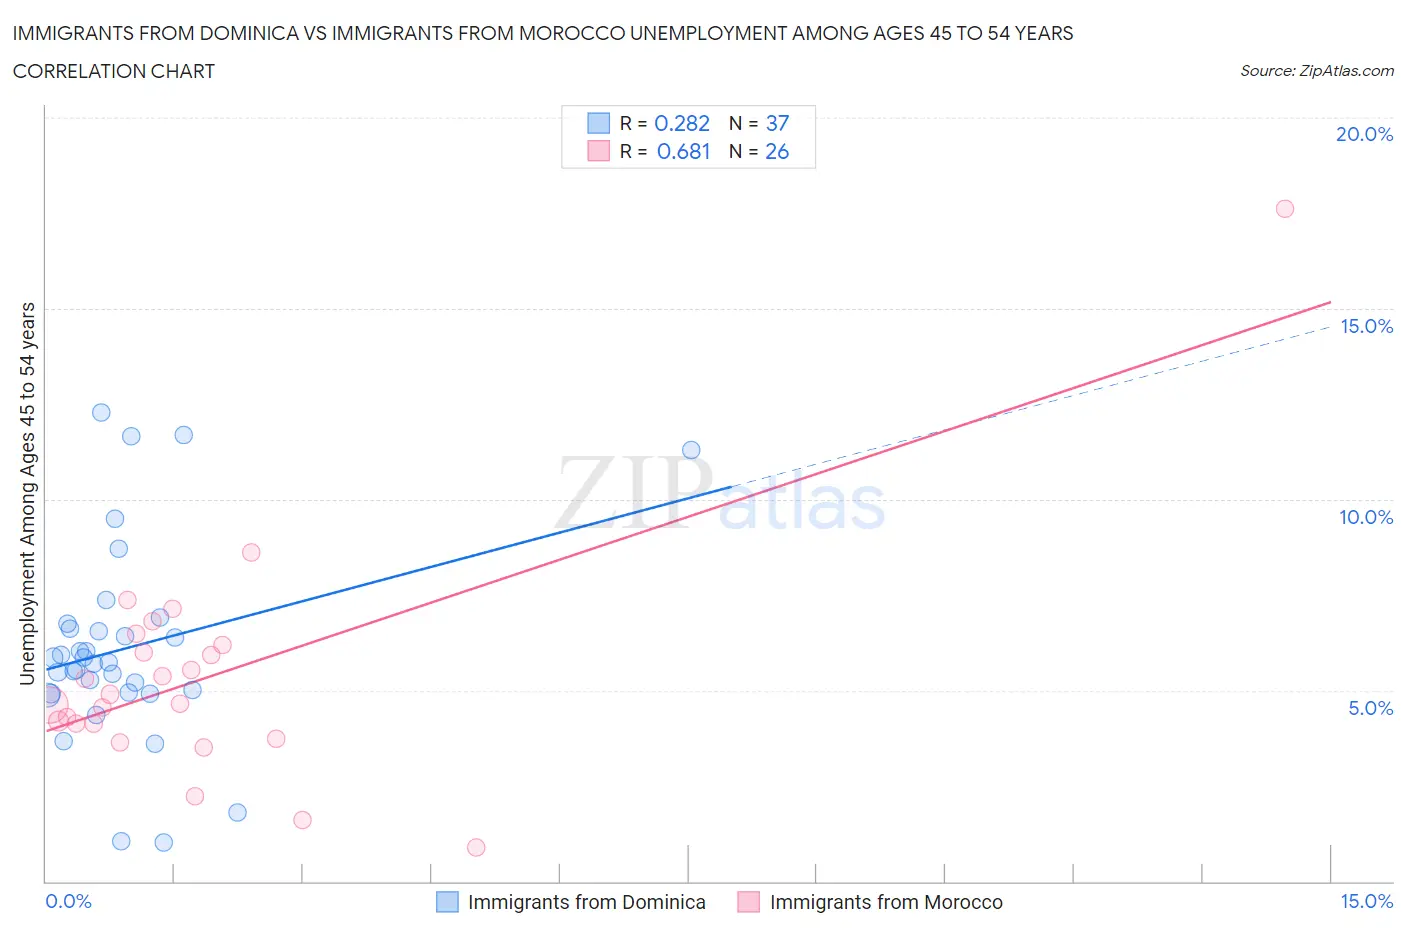
Immigrants from Dominica vs Immigrants from Morocco Unemployment Among Ages 45 to 54 years Correlation Chart
The statistical analysis conducted on geographies consisting of 83,459,757 people shows a weak positive correlation between the proportion of Immigrants from Dominica and unemployment rate among population between the ages 45 and 54 in the United States with a correlation coefficient (R) of 0.282 and weighted average of 5.6%. Similarly, the statistical analysis conducted on geographies consisting of 177,764,319 people shows a significant positive correlation between the proportion of Immigrants from Morocco and unemployment rate among population between the ages 45 and 54 in the United States with a correlation coefficient (R) of 0.681 and weighted average of 4.6%, a difference of 21.9%.
Unemployment Among Ages 45 to 54 years Correlation Summary
| Measurement | Immigrants from Dominica | Immigrants from Morocco |
| Minimum | 1.0% | 0.90% |
| Maximum | 12.3% | 17.6% |
| Range | 11.3% | 16.7% |
| Mean | 6.1% | 5.4% |
| Median | 5.7% | 4.8% |
| Interquartile 25% (IQ1) | 4.9% | 4.1% |
| Interquartile 75% (IQ3) | 6.7% | 6.2% |
| Interquartile Range (IQR) | 1.7% | 2.1% |
| Standard Deviation (Sample) | 2.6% | 3.1% |
| Standard Deviation (Population) | 2.6% | 3.0% |
Similar Demographics by Unemployment Among Ages 45 to 54 years
Demographics Similar to Immigrants from Dominica by Unemployment Among Ages 45 to 54 years
In terms of unemployment among ages 45 to 54 years, the demographic groups most similar to Immigrants from Dominica are Guyanese (5.6%, a difference of 0.18%), Immigrants from Guyana (5.6%, a difference of 0.20%), Houma (5.6%, a difference of 0.30%), Shoshone (5.6%, a difference of 0.51%), and Immigrants from Grenada (5.6%, a difference of 0.55%).
| Demographics | Rating | Rank | Unemployment Among Ages 45 to 54 years |
| Blacks/African Americans | 0.0 /100 | #308 | Tragic 5.4% |
| Barbadians | 0.0 /100 | #309 | Tragic 5.5% |
| Immigrants | Barbados | 0.0 /100 | #310 | Tragic 5.5% |
| Chippewa | 0.0 /100 | #311 | Tragic 5.5% |
| Immigrants | Grenada | 0.0 /100 | #312 | Tragic 5.6% |
| Shoshone | 0.0 /100 | #313 | Tragic 5.6% |
| Guyanese | 0.0 /100 | #314 | Tragic 5.6% |
| Immigrants | Dominica | 0.0 /100 | #315 | Tragic 5.6% |
| Immigrants | Guyana | 0.0 /100 | #316 | Tragic 5.6% |
| Houma | 0.0 /100 | #317 | Tragic 5.6% |
| British West Indians | 0.0 /100 | #318 | Tragic 5.7% |
| Cape Verdeans | 0.0 /100 | #319 | Tragic 5.7% |
| Immigrants | St. Vincent and the Grenadines | 0.0 /100 | #320 | Tragic 5.7% |
| Yakama | 0.0 /100 | #321 | Tragic 5.7% |
| Immigrants | Azores | 0.0 /100 | #322 | Tragic 5.7% |
Demographics Similar to Immigrants from Morocco by Unemployment Among Ages 45 to 54 years
In terms of unemployment among ages 45 to 54 years, the demographic groups most similar to Immigrants from Morocco are Immigrants from Greece (4.6%, a difference of 0.050%), Liberian (4.6%, a difference of 0.15%), Immigrants from Peru (4.6%, a difference of 0.18%), Immigrants from Costa Rica (4.6%, a difference of 0.22%), and Immigrants from Denmark (4.6%, a difference of 0.23%).
| Demographics | Rating | Rank | Unemployment Among Ages 45 to 54 years |
| Albanians | 31.1 /100 | #197 | Fair 4.6% |
| Immigrants | Belarus | 30.6 /100 | #198 | Fair 4.6% |
| Brazilians | 20.1 /100 | #199 | Fair 4.6% |
| Immigrants | Denmark | 19.8 /100 | #200 | Poor 4.6% |
| Immigrants | Costa Rica | 19.7 /100 | #201 | Poor 4.6% |
| Immigrants | Peru | 19.1 /100 | #202 | Poor 4.6% |
| Liberians | 18.7 /100 | #203 | Poor 4.6% |
| Immigrants | Morocco | 16.8 /100 | #204 | Poor 4.6% |
| Immigrants | Greece | 16.2 /100 | #205 | Poor 4.6% |
| Immigrants | Switzerland | 14.0 /100 | #206 | Poor 4.6% |
| Arabs | 13.7 /100 | #207 | Poor 4.6% |
| Immigrants | Africa | 13.6 /100 | #208 | Poor 4.6% |
| Immigrants | Nigeria | 13.3 /100 | #209 | Poor 4.6% |
| Immigrants | South America | 12.2 /100 | #210 | Poor 4.6% |
| Creek | 11.9 /100 | #211 | Poor 4.6% |