Immigrants from Dominica vs Immigrants from Korea Master's Degree
COMPARE
Immigrants from Dominica
Immigrants from Korea
Master's Degree
Master's Degree Comparison
Immigrants from Dominica
Immigrants from Korea
12.6%
MASTER'S DEGREE
0.8/ 100
METRIC RATING
253rd/ 347
METRIC RANK
19.7%
MASTER'S DEGREE
100.0/ 100
METRIC RATING
31st/ 347
METRIC RANK
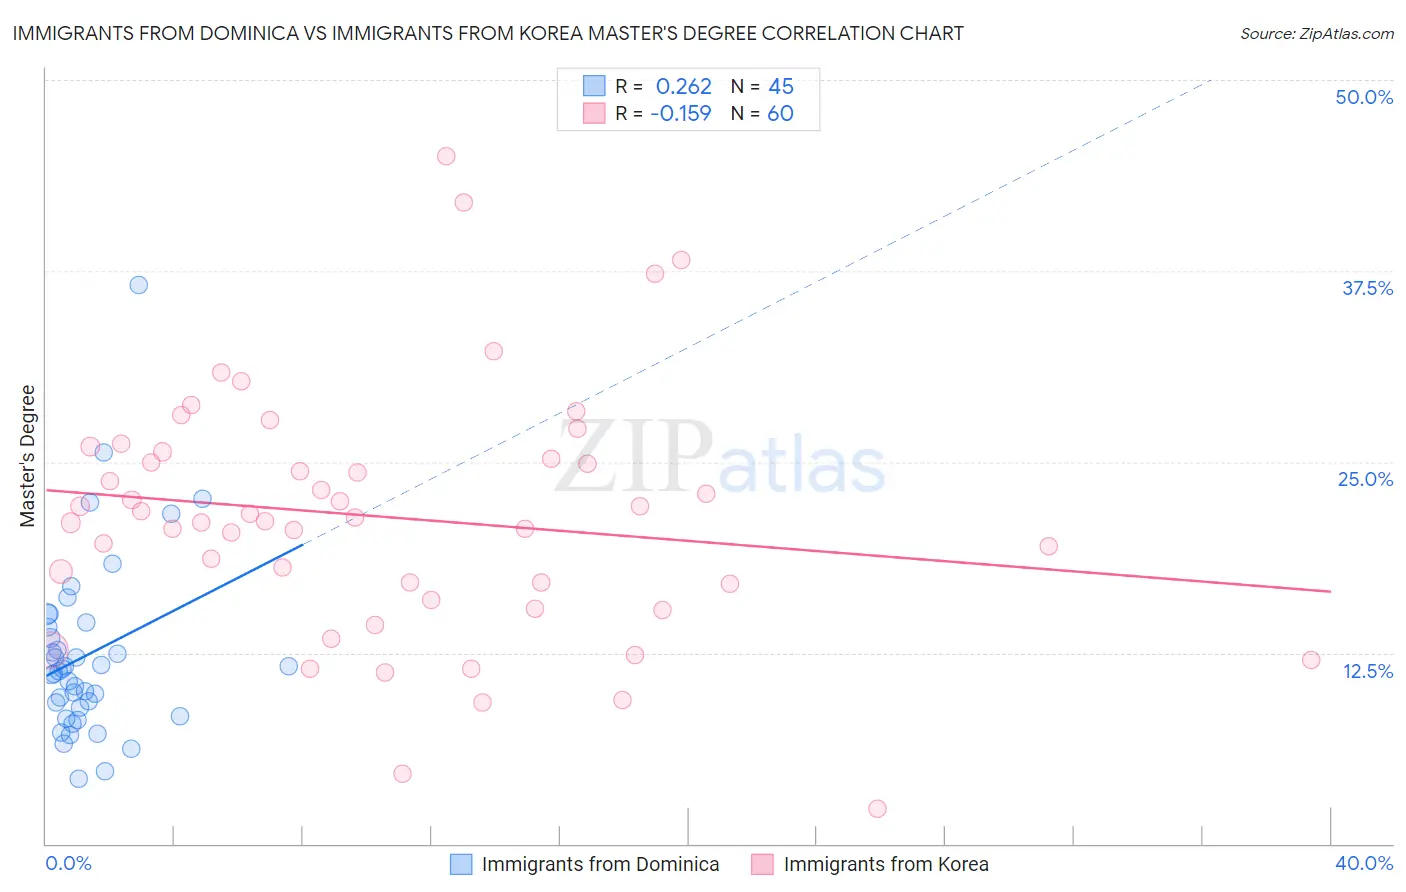
Immigrants from Dominica vs Immigrants from Korea Master's Degree Correlation Chart
The statistical analysis conducted on geographies consisting of 83,792,666 people shows a weak positive correlation between the proportion of Immigrants from Dominica and percentage of population with at least master's degree education in the United States with a correlation coefficient (R) of 0.262 and weighted average of 12.6%. Similarly, the statistical analysis conducted on geographies consisting of 416,166,460 people shows a poor negative correlation between the proportion of Immigrants from Korea and percentage of population with at least master's degree education in the United States with a correlation coefficient (R) of -0.159 and weighted average of 19.7%, a difference of 55.9%.
Master's Degree Correlation Summary
| Measurement | Immigrants from Dominica | Immigrants from Korea |
| Minimum | 4.3% | 2.3% |
| Maximum | 36.5% | 45.0% |
| Range | 32.3% | 42.7% |
| Mean | 12.4% | 21.4% |
| Median | 11.3% | 21.2% |
| Interquartile 25% (IQ1) | 8.6% | 16.5% |
| Interquartile 75% (IQ3) | 14.4% | 25.4% |
| Interquartile Range (IQR) | 5.7% | 9.0% |
| Standard Deviation (Sample) | 6.0% | 8.2% |
| Standard Deviation (Population) | 5.9% | 8.1% |
Similar Demographics by Master's Degree
Demographics Similar to Immigrants from Dominica by Master's Degree
In terms of master's degree, the demographic groups most similar to Immigrants from Dominica are Indonesian (12.6%, a difference of 0.040%), Immigrants from Congo (12.6%, a difference of 0.070%), Immigrants from Portugal (12.6%, a difference of 0.14%), French American Indian (12.7%, a difference of 0.54%), and Osage (12.6%, a difference of 0.62%).
| Demographics | Rating | Rank | Master's Degree |
| Immigrants | Cambodia | 1.4 /100 | #246 | Tragic 12.9% |
| Iroquois | 1.4 /100 | #247 | Tragic 12.9% |
| Africans | 1.4 /100 | #248 | Tragic 12.9% |
| Cree | 1.3 /100 | #249 | Tragic 12.8% |
| Liberians | 1.3 /100 | #250 | Tragic 12.8% |
| Tlingit-Haida | 1.3 /100 | #251 | Tragic 12.8% |
| French American Indians | 1.0 /100 | #252 | Tragic 12.7% |
| Immigrants | Dominica | 0.8 /100 | #253 | Tragic 12.6% |
| Indonesians | 0.8 /100 | #254 | Tragic 12.6% |
| Immigrants | Congo | 0.8 /100 | #255 | Tragic 12.6% |
| Immigrants | Portugal | 0.8 /100 | #256 | Tragic 12.6% |
| Osage | 0.7 /100 | #257 | Tragic 12.6% |
| Immigrants | Liberia | 0.6 /100 | #258 | Tragic 12.5% |
| Japanese | 0.6 /100 | #259 | Tragic 12.5% |
| Dominicans | 0.6 /100 | #260 | Tragic 12.5% |
Demographics Similar to Immigrants from Korea by Master's Degree
In terms of master's degree, the demographic groups most similar to Immigrants from Korea are Immigrants from Turkey (19.7%, a difference of 0.010%), Burmese (19.7%, a difference of 0.070%), Latvian (19.8%, a difference of 0.52%), Russian (19.5%, a difference of 0.85%), and Immigrants from Denmark (19.5%, a difference of 0.88%).
| Demographics | Rating | Rank | Master's Degree |
| Immigrants | Sweden | 100.0 /100 | #24 | Exceptional 20.3% |
| Immigrants | Japan | 100.0 /100 | #25 | Exceptional 20.0% |
| Cambodians | 100.0 /100 | #26 | Exceptional 20.0% |
| Immigrants | Sri Lanka | 100.0 /100 | #27 | Exceptional 19.9% |
| Turks | 100.0 /100 | #28 | Exceptional 19.9% |
| Latvians | 100.0 /100 | #29 | Exceptional 19.8% |
| Immigrants | Turkey | 100.0 /100 | #30 | Exceptional 19.7% |
| Immigrants | Korea | 100.0 /100 | #31 | Exceptional 19.7% |
| Burmese | 100.0 /100 | #32 | Exceptional 19.7% |
| Russians | 100.0 /100 | #33 | Exceptional 19.5% |
| Immigrants | Denmark | 100.0 /100 | #34 | Exceptional 19.5% |
| Immigrants | Northern Europe | 100.0 /100 | #35 | Exceptional 19.5% |
| Immigrants | Russia | 100.0 /100 | #36 | Exceptional 19.4% |
| Mongolians | 100.0 /100 | #37 | Exceptional 19.4% |
| Bolivians | 100.0 /100 | #38 | Exceptional 19.3% |