Immigrants from Western Africa vs Immigrants from Korea Master's Degree
COMPARE
Immigrants from Western Africa
Immigrants from Korea
Master's Degree
Master's Degree Comparison
Immigrants from Western Africa
Immigrants from Korea
14.4%
MASTER'S DEGREE
24.9/ 100
METRIC RATING
202nd/ 347
METRIC RANK
19.7%
MASTER'S DEGREE
100.0/ 100
METRIC RATING
31st/ 347
METRIC RANK
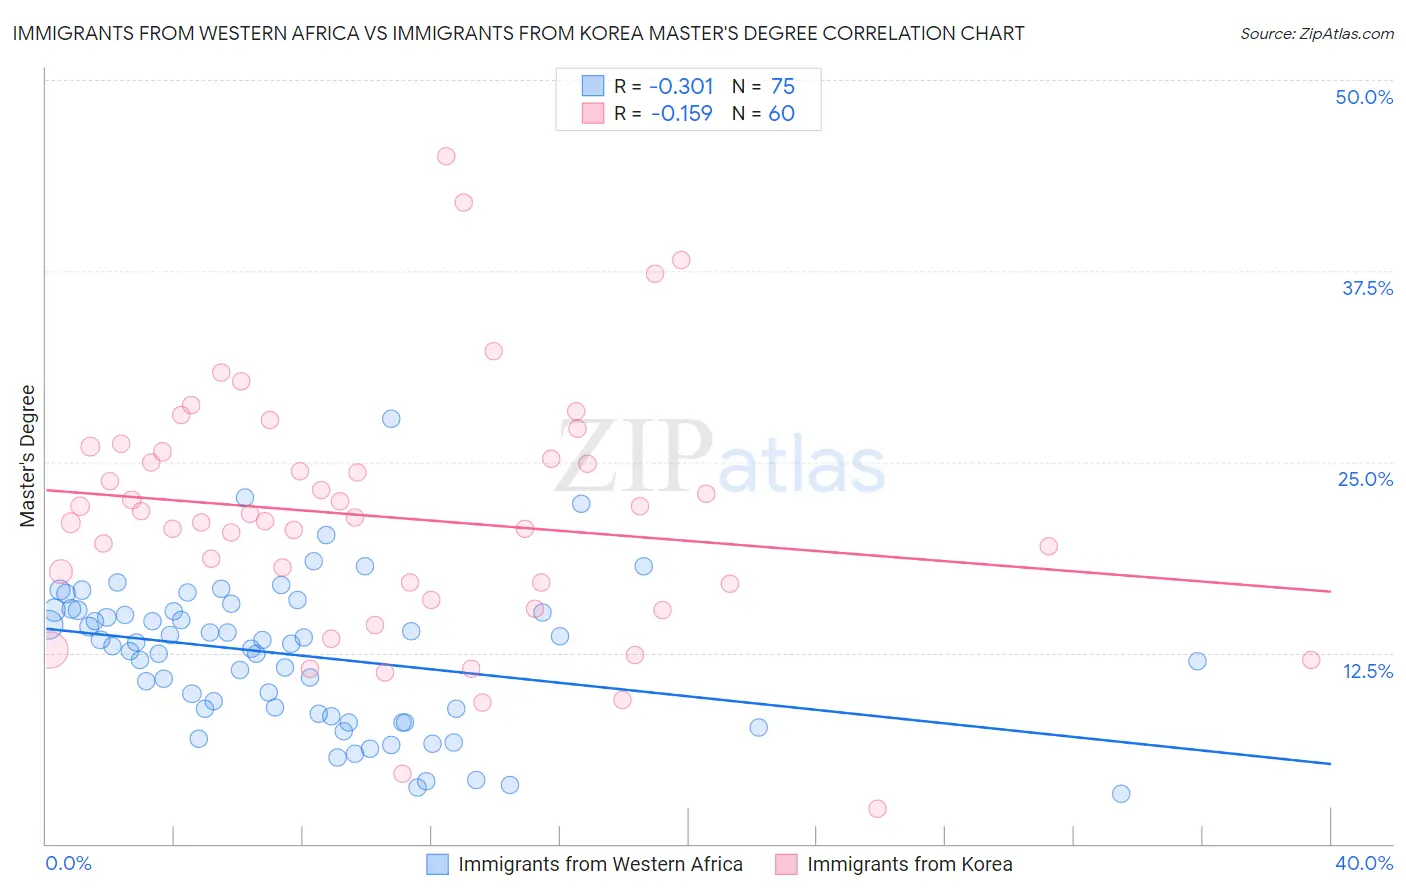
Immigrants from Western Africa vs Immigrants from Korea Master's Degree Correlation Chart
The statistical analysis conducted on geographies consisting of 357,742,220 people shows a mild negative correlation between the proportion of Immigrants from Western Africa and percentage of population with at least master's degree education in the United States with a correlation coefficient (R) of -0.301 and weighted average of 14.4%. Similarly, the statistical analysis conducted on geographies consisting of 416,166,460 people shows a poor negative correlation between the proportion of Immigrants from Korea and percentage of population with at least master's degree education in the United States with a correlation coefficient (R) of -0.159 and weighted average of 19.7%, a difference of 37.0%.
Master's Degree Correlation Summary
| Measurement | Immigrants from Western Africa | Immigrants from Korea |
| Minimum | 3.3% | 2.3% |
| Maximum | 27.9% | 45.0% |
| Range | 24.6% | 42.7% |
| Mean | 12.4% | 21.4% |
| Median | 13.1% | 21.2% |
| Interquartile 25% (IQ1) | 8.5% | 16.5% |
| Interquartile 75% (IQ3) | 15.3% | 25.4% |
| Interquartile Range (IQR) | 6.8% | 9.0% |
| Standard Deviation (Sample) | 4.8% | 8.2% |
| Standard Deviation (Population) | 4.7% | 8.1% |
Similar Demographics by Master's Degree
Demographics Similar to Immigrants from Western Africa by Master's Degree
In terms of master's degree, the demographic groups most similar to Immigrants from Western Africa are Scotch-Irish (14.4%, a difference of 0.010%), Panamanian (14.4%, a difference of 0.020%), Yugoslavian (14.4%, a difference of 0.11%), French (14.4%, a difference of 0.22%), and Trinidadian and Tobagonian (14.4%, a difference of 0.26%).
| Demographics | Rating | Rank | Master's Degree |
| Danes | 31.3 /100 | #195 | Fair 14.5% |
| Czechoslovakians | 29.9 /100 | #196 | Fair 14.5% |
| Belgians | 28.0 /100 | #197 | Fair 14.5% |
| West Indians | 27.4 /100 | #198 | Fair 14.5% |
| Immigrants | Armenia | 27.2 /100 | #199 | Fair 14.5% |
| Panamanians | 25.1 /100 | #200 | Fair 14.4% |
| Scotch-Irish | 25.0 /100 | #201 | Fair 14.4% |
| Immigrants | Western Africa | 24.9 /100 | #202 | Fair 14.4% |
| Yugoslavians | 24.3 /100 | #203 | Fair 14.4% |
| French | 23.7 /100 | #204 | Fair 14.4% |
| Trinidadians and Tobagonians | 23.5 /100 | #205 | Fair 14.4% |
| Scandinavians | 23.3 /100 | #206 | Fair 14.4% |
| Immigrants | Bosnia and Herzegovina | 22.0 /100 | #207 | Fair 14.3% |
| Immigrants | Barbados | 20.5 /100 | #208 | Fair 14.3% |
| Immigrants | Panama | 20.0 /100 | #209 | Fair 14.3% |
Demographics Similar to Immigrants from Korea by Master's Degree
In terms of master's degree, the demographic groups most similar to Immigrants from Korea are Immigrants from Turkey (19.7%, a difference of 0.010%), Burmese (19.7%, a difference of 0.070%), Latvian (19.8%, a difference of 0.52%), Russian (19.5%, a difference of 0.85%), and Immigrants from Denmark (19.5%, a difference of 0.88%).
| Demographics | Rating | Rank | Master's Degree |
| Immigrants | Sweden | 100.0 /100 | #24 | Exceptional 20.3% |
| Immigrants | Japan | 100.0 /100 | #25 | Exceptional 20.0% |
| Cambodians | 100.0 /100 | #26 | Exceptional 20.0% |
| Immigrants | Sri Lanka | 100.0 /100 | #27 | Exceptional 19.9% |
| Turks | 100.0 /100 | #28 | Exceptional 19.9% |
| Latvians | 100.0 /100 | #29 | Exceptional 19.8% |
| Immigrants | Turkey | 100.0 /100 | #30 | Exceptional 19.7% |
| Immigrants | Korea | 100.0 /100 | #31 | Exceptional 19.7% |
| Burmese | 100.0 /100 | #32 | Exceptional 19.7% |
| Russians | 100.0 /100 | #33 | Exceptional 19.5% |
| Immigrants | Denmark | 100.0 /100 | #34 | Exceptional 19.5% |
| Immigrants | Northern Europe | 100.0 /100 | #35 | Exceptional 19.5% |
| Immigrants | Russia | 100.0 /100 | #36 | Exceptional 19.4% |
| Mongolians | 100.0 /100 | #37 | Exceptional 19.4% |
| Bolivians | 100.0 /100 | #38 | Exceptional 19.3% |