Jamaican vs Immigrants from Korea Master's Degree
COMPARE
Jamaican
Immigrants from Korea
Master's Degree
Master's Degree Comparison
Jamaicans
Immigrants from Korea
13.4%
MASTER'S DEGREE
4.1/ 100
METRIC RATING
237th/ 347
METRIC RANK
19.7%
MASTER'S DEGREE
100.0/ 100
METRIC RATING
31st/ 347
METRIC RANK
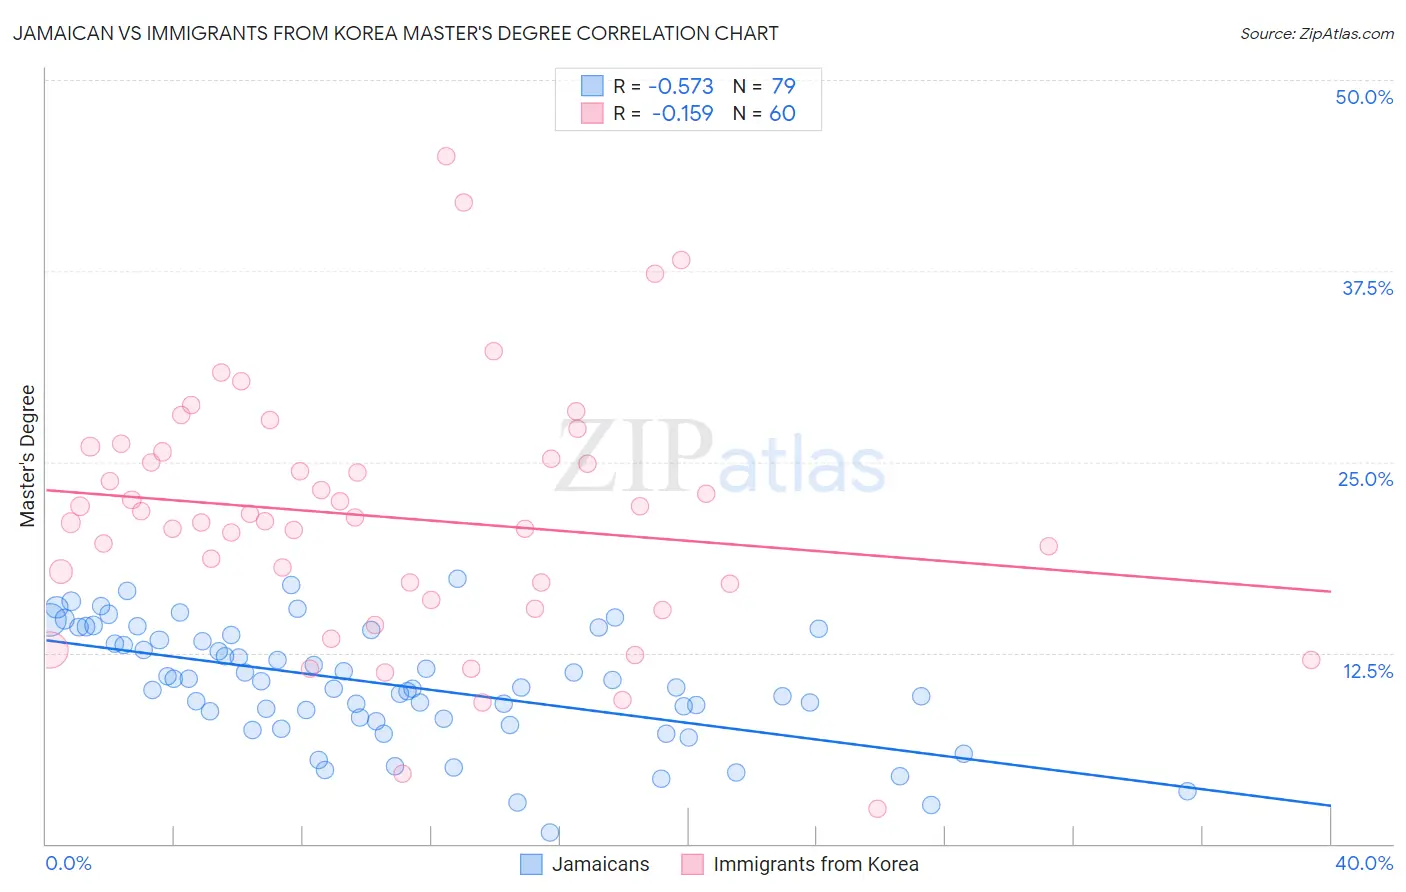
Jamaican vs Immigrants from Korea Master's Degree Correlation Chart
The statistical analysis conducted on geographies consisting of 367,857,102 people shows a substantial negative correlation between the proportion of Jamaicans and percentage of population with at least master's degree education in the United States with a correlation coefficient (R) of -0.573 and weighted average of 13.4%. Similarly, the statistical analysis conducted on geographies consisting of 416,166,460 people shows a poor negative correlation between the proportion of Immigrants from Korea and percentage of population with at least master's degree education in the United States with a correlation coefficient (R) of -0.159 and weighted average of 19.7%, a difference of 46.9%.
Master's Degree Correlation Summary
| Measurement | Jamaican | Immigrants from Korea |
| Minimum | 0.72% | 2.3% |
| Maximum | 17.3% | 45.0% |
| Range | 16.6% | 42.7% |
| Mean | 10.4% | 21.4% |
| Median | 10.2% | 21.2% |
| Interquartile 25% (IQ1) | 8.2% | 16.5% |
| Interquartile 75% (IQ3) | 13.7% | 25.4% |
| Interquartile Range (IQR) | 5.5% | 9.0% |
| Standard Deviation (Sample) | 3.8% | 8.2% |
| Standard Deviation (Population) | 3.7% | 8.1% |
Similar Demographics by Master's Degree
Demographics Similar to Jamaicans by Master's Degree
In terms of master's degree, the demographic groups most similar to Jamaicans are Hmong (13.4%, a difference of 0.14%), Immigrants from Guyana (13.4%, a difference of 0.22%), German Russian (13.5%, a difference of 0.34%), Nonimmigrants (13.3%, a difference of 0.67%), and Immigrants from Burma/Myanmar (13.5%, a difference of 0.75%).
| Demographics | Rating | Rank | Master's Degree |
| Dutch | 8.7 /100 | #230 | Tragic 13.8% |
| Guyanese | 7.6 /100 | #231 | Tragic 13.7% |
| Immigrants | Philippines | 6.0 /100 | #232 | Tragic 13.6% |
| Immigrants | Ecuador | 5.7 /100 | #233 | Tragic 13.6% |
| Immigrants | Burma/Myanmar | 5.0 /100 | #234 | Tragic 13.5% |
| German Russians | 4.5 /100 | #235 | Tragic 13.5% |
| Immigrants | Guyana | 4.4 /100 | #236 | Tragic 13.4% |
| Jamaicans | 4.1 /100 | #237 | Tragic 13.4% |
| Hmong | 4.0 /100 | #238 | Tragic 13.4% |
| Immigrants | Nonimmigrants | 3.4 /100 | #239 | Tragic 13.3% |
| Guamanians/Chamorros | 2.2 /100 | #240 | Tragic 13.1% |
| U.S. Virgin Islanders | 2.1 /100 | #241 | Tragic 13.1% |
| Spanish Americans | 1.9 /100 | #242 | Tragic 13.0% |
| Immigrants | Jamaica | 1.9 /100 | #243 | Tragic 13.0% |
| Delaware | 1.7 /100 | #244 | Tragic 13.0% |
Demographics Similar to Immigrants from Korea by Master's Degree
In terms of master's degree, the demographic groups most similar to Immigrants from Korea are Immigrants from Turkey (19.7%, a difference of 0.010%), Burmese (19.7%, a difference of 0.070%), Latvian (19.8%, a difference of 0.52%), Russian (19.5%, a difference of 0.85%), and Immigrants from Denmark (19.5%, a difference of 0.88%).
| Demographics | Rating | Rank | Master's Degree |
| Immigrants | Sweden | 100.0 /100 | #24 | Exceptional 20.3% |
| Immigrants | Japan | 100.0 /100 | #25 | Exceptional 20.0% |
| Cambodians | 100.0 /100 | #26 | Exceptional 20.0% |
| Immigrants | Sri Lanka | 100.0 /100 | #27 | Exceptional 19.9% |
| Turks | 100.0 /100 | #28 | Exceptional 19.9% |
| Latvians | 100.0 /100 | #29 | Exceptional 19.8% |
| Immigrants | Turkey | 100.0 /100 | #30 | Exceptional 19.7% |
| Immigrants | Korea | 100.0 /100 | #31 | Exceptional 19.7% |
| Burmese | 100.0 /100 | #32 | Exceptional 19.7% |
| Russians | 100.0 /100 | #33 | Exceptional 19.5% |
| Immigrants | Denmark | 100.0 /100 | #34 | Exceptional 19.5% |
| Immigrants | Northern Europe | 100.0 /100 | #35 | Exceptional 19.5% |
| Immigrants | Russia | 100.0 /100 | #36 | Exceptional 19.4% |
| Mongolians | 100.0 /100 | #37 | Exceptional 19.4% |
| Bolivians | 100.0 /100 | #38 | Exceptional 19.3% |