Immigrants from Dominica vs Cuban Master's Degree
COMPARE
Immigrants from Dominica
Cuban
Master's Degree
Master's Degree Comparison
Immigrants from Dominica
Cubans
12.6%
MASTER'S DEGREE
0.8/ 100
METRIC RATING
253rd/ 347
METRIC RANK
12.1%
MASTER'S DEGREE
0.3/ 100
METRIC RATING
275th/ 347
METRIC RANK
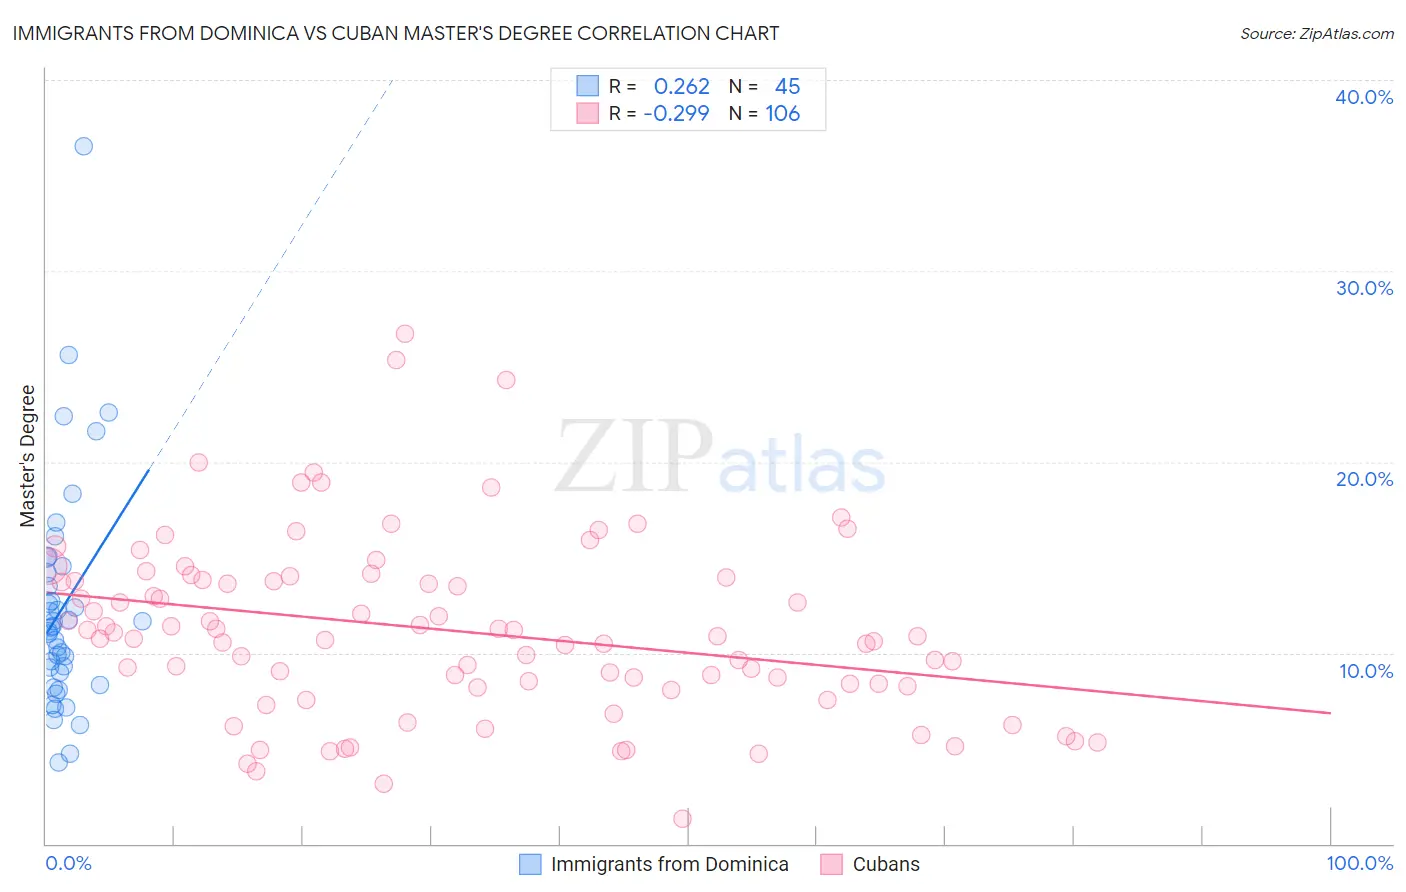
Immigrants from Dominica vs Cuban Master's Degree Correlation Chart
The statistical analysis conducted on geographies consisting of 83,792,666 people shows a weak positive correlation between the proportion of Immigrants from Dominica and percentage of population with at least master's degree education in the United States with a correlation coefficient (R) of 0.262 and weighted average of 12.6%. Similarly, the statistical analysis conducted on geographies consisting of 449,063,887 people shows a weak negative correlation between the proportion of Cubans and percentage of population with at least master's degree education in the United States with a correlation coefficient (R) of -0.299 and weighted average of 12.1%, a difference of 4.7%.
Master's Degree Correlation Summary
| Measurement | Immigrants from Dominica | Cuban |
| Minimum | 4.3% | 1.3% |
| Maximum | 36.5% | 26.7% |
| Range | 32.3% | 25.4% |
| Mean | 12.4% | 11.1% |
| Median | 11.3% | 10.8% |
| Interquartile 25% (IQ1) | 8.6% | 8.3% |
| Interquartile 75% (IQ3) | 14.4% | 13.8% |
| Interquartile Range (IQR) | 5.7% | 5.5% |
| Standard Deviation (Sample) | 6.0% | 4.7% |
| Standard Deviation (Population) | 5.9% | 4.7% |
Similar Demographics by Master's Degree
Demographics Similar to Immigrants from Dominica by Master's Degree
In terms of master's degree, the demographic groups most similar to Immigrants from Dominica are Indonesian (12.6%, a difference of 0.040%), Immigrants from Congo (12.6%, a difference of 0.070%), Immigrants from Portugal (12.6%, a difference of 0.14%), French American Indian (12.7%, a difference of 0.54%), and Osage (12.6%, a difference of 0.62%).
| Demographics | Rating | Rank | Master's Degree |
| Immigrants | Cambodia | 1.4 /100 | #246 | Tragic 12.9% |
| Iroquois | 1.4 /100 | #247 | Tragic 12.9% |
| Africans | 1.4 /100 | #248 | Tragic 12.9% |
| Cree | 1.3 /100 | #249 | Tragic 12.8% |
| Liberians | 1.3 /100 | #250 | Tragic 12.8% |
| Tlingit-Haida | 1.3 /100 | #251 | Tragic 12.8% |
| French American Indians | 1.0 /100 | #252 | Tragic 12.7% |
| Immigrants | Dominica | 0.8 /100 | #253 | Tragic 12.6% |
| Indonesians | 0.8 /100 | #254 | Tragic 12.6% |
| Immigrants | Congo | 0.8 /100 | #255 | Tragic 12.6% |
| Immigrants | Portugal | 0.8 /100 | #256 | Tragic 12.6% |
| Osage | 0.7 /100 | #257 | Tragic 12.6% |
| Immigrants | Liberia | 0.6 /100 | #258 | Tragic 12.5% |
| Japanese | 0.6 /100 | #259 | Tragic 12.5% |
| Dominicans | 0.6 /100 | #260 | Tragic 12.5% |
Demographics Similar to Cubans by Master's Degree
In terms of master's degree, the demographic groups most similar to Cubans are Cape Verdean (12.1%, a difference of 0.020%), Black/African American (12.1%, a difference of 0.050%), Immigrants from Caribbean (12.1%, a difference of 0.060%), Potawatomi (12.1%, a difference of 0.070%), and Blackfeet (12.1%, a difference of 0.10%).
| Demographics | Rating | Rank | Master's Degree |
| Native Hawaiians | 0.4 /100 | #268 | Tragic 12.3% |
| Central Americans | 0.3 /100 | #269 | Tragic 12.2% |
| Salvadorans | 0.3 /100 | #270 | Tragic 12.2% |
| Haitians | 0.3 /100 | #271 | Tragic 12.1% |
| Comanche | 0.3 /100 | #272 | Tragic 12.1% |
| Blackfeet | 0.3 /100 | #273 | Tragic 12.1% |
| Cape Verdeans | 0.3 /100 | #274 | Tragic 12.1% |
| Cubans | 0.3 /100 | #275 | Tragic 12.1% |
| Blacks/African Americans | 0.3 /100 | #276 | Tragic 12.1% |
| Immigrants | Caribbean | 0.3 /100 | #277 | Tragic 12.1% |
| Potawatomi | 0.3 /100 | #278 | Tragic 12.1% |
| Immigrants | Belize | 0.2 /100 | #279 | Tragic 12.1% |
| Immigrants | Dominican Republic | 0.2 /100 | #280 | Tragic 12.1% |
| Malaysians | 0.2 /100 | #281 | Tragic 12.0% |
| Immigrants | El Salvador | 0.2 /100 | #282 | Tragic 12.0% |