Immigrants from Dominica vs Pima Master's Degree
COMPARE
Immigrants from Dominica
Pima
Master's Degree
Master's Degree Comparison
Immigrants from Dominica
Pima
12.6%
MASTER'S DEGREE
0.8/ 100
METRIC RATING
253rd/ 347
METRIC RANK
9.2%
MASTER'S DEGREE
0.0/ 100
METRIC RATING
344th/ 347
METRIC RANK
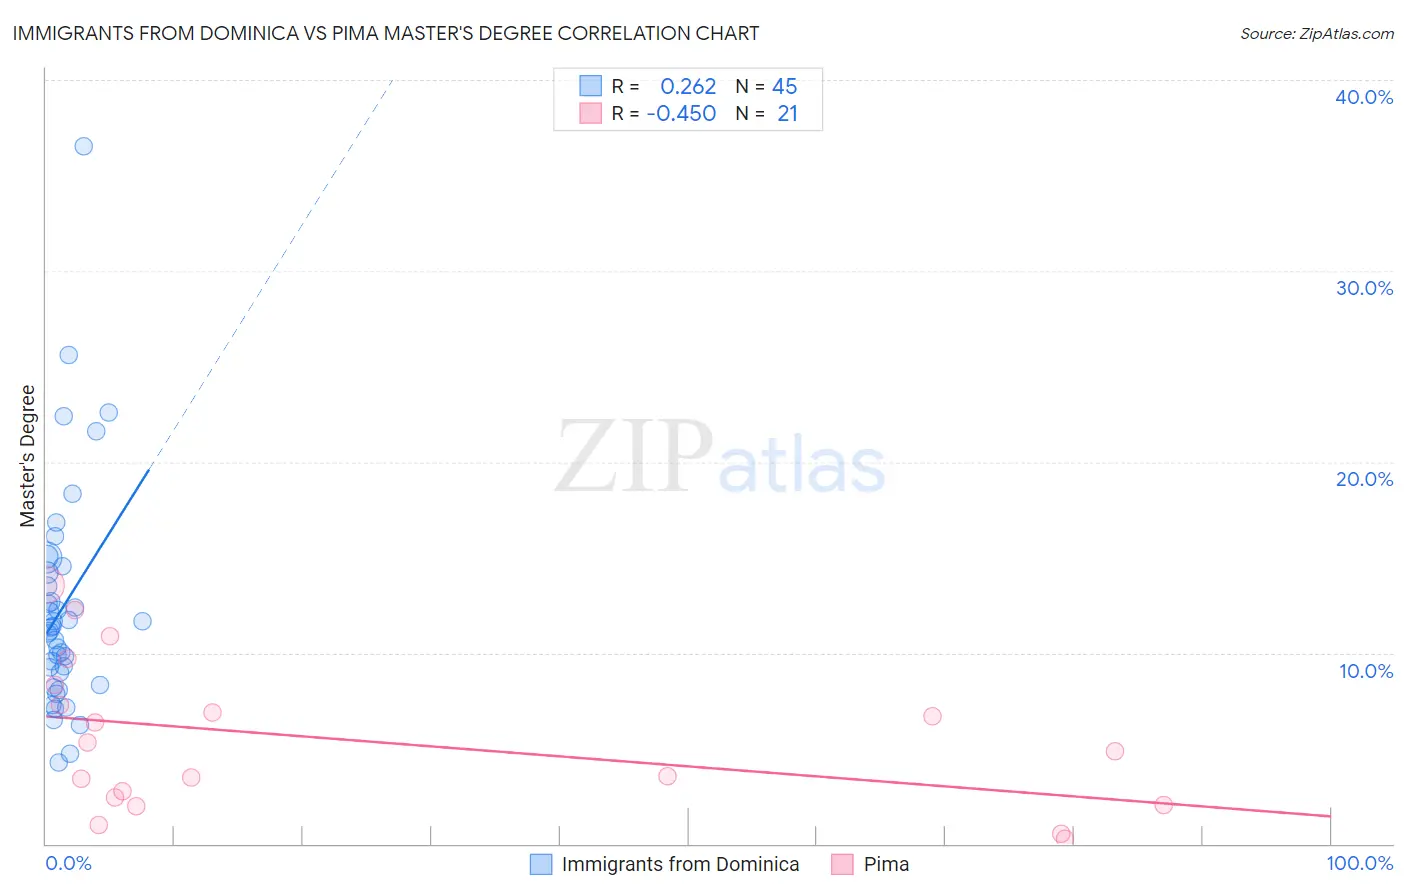
Immigrants from Dominica vs Pima Master's Degree Correlation Chart
The statistical analysis conducted on geographies consisting of 83,792,666 people shows a weak positive correlation between the proportion of Immigrants from Dominica and percentage of population with at least master's degree education in the United States with a correlation coefficient (R) of 0.262 and weighted average of 12.6%. Similarly, the statistical analysis conducted on geographies consisting of 61,537,542 people shows a moderate negative correlation between the proportion of Pima and percentage of population with at least master's degree education in the United States with a correlation coefficient (R) of -0.450 and weighted average of 9.2%, a difference of 36.7%.
Master's Degree Correlation Summary
| Measurement | Immigrants from Dominica | Pima |
| Minimum | 4.3% | 0.28% |
| Maximum | 36.5% | 13.6% |
| Range | 32.3% | 13.3% |
| Mean | 12.4% | 5.4% |
| Median | 11.3% | 4.8% |
| Interquartile 25% (IQ1) | 8.6% | 2.2% |
| Interquartile 75% (IQ3) | 14.4% | 7.8% |
| Interquartile Range (IQR) | 5.7% | 5.6% |
| Standard Deviation (Sample) | 6.0% | 3.9% |
| Standard Deviation (Population) | 5.9% | 3.8% |
Similar Demographics by Master's Degree
Demographics Similar to Immigrants from Dominica by Master's Degree
In terms of master's degree, the demographic groups most similar to Immigrants from Dominica are Indonesian (12.6%, a difference of 0.040%), Immigrants from Congo (12.6%, a difference of 0.070%), Immigrants from Portugal (12.6%, a difference of 0.14%), French American Indian (12.7%, a difference of 0.54%), and Osage (12.6%, a difference of 0.62%).
| Demographics | Rating | Rank | Master's Degree |
| Immigrants | Cambodia | 1.4 /100 | #246 | Tragic 12.9% |
| Iroquois | 1.4 /100 | #247 | Tragic 12.9% |
| Africans | 1.4 /100 | #248 | Tragic 12.9% |
| Cree | 1.3 /100 | #249 | Tragic 12.8% |
| Liberians | 1.3 /100 | #250 | Tragic 12.8% |
| Tlingit-Haida | 1.3 /100 | #251 | Tragic 12.8% |
| French American Indians | 1.0 /100 | #252 | Tragic 12.7% |
| Immigrants | Dominica | 0.8 /100 | #253 | Tragic 12.6% |
| Indonesians | 0.8 /100 | #254 | Tragic 12.6% |
| Immigrants | Congo | 0.8 /100 | #255 | Tragic 12.6% |
| Immigrants | Portugal | 0.8 /100 | #256 | Tragic 12.6% |
| Osage | 0.7 /100 | #257 | Tragic 12.6% |
| Immigrants | Liberia | 0.6 /100 | #258 | Tragic 12.5% |
| Japanese | 0.6 /100 | #259 | Tragic 12.5% |
| Dominicans | 0.6 /100 | #260 | Tragic 12.5% |
Demographics Similar to Pima by Master's Degree
In terms of master's degree, the demographic groups most similar to Pima are Yuman (9.2%, a difference of 0.15%), Lumbee (9.3%, a difference of 0.17%), Immigrants from Mexico (9.3%, a difference of 0.65%), Navajo (9.4%, a difference of 1.9%), and Yakama (9.5%, a difference of 2.3%).
| Demographics | Rating | Rank | Master's Degree |
| Menominee | 0.0 /100 | #333 | Tragic 10.2% |
| Arapaho | 0.0 /100 | #334 | Tragic 10.0% |
| Immigrants | Central America | 0.0 /100 | #335 | Tragic 10.0% |
| Natives/Alaskans | 0.0 /100 | #336 | Tragic 9.9% |
| Mexicans | 0.0 /100 | #337 | Tragic 9.7% |
| Tohono O'odham | 0.0 /100 | #338 | Tragic 9.7% |
| Spanish American Indians | 0.0 /100 | #339 | Tragic 9.6% |
| Yakama | 0.0 /100 | #340 | Tragic 9.5% |
| Navajo | 0.0 /100 | #341 | Tragic 9.4% |
| Immigrants | Mexico | 0.0 /100 | #342 | Tragic 9.3% |
| Lumbee | 0.0 /100 | #343 | Tragic 9.3% |
| Pima | 0.0 /100 | #344 | Tragic 9.2% |
| Yuman | 0.0 /100 | #345 | Tragic 9.2% |
| Yup'ik | 0.0 /100 | #346 | Tragic 8.5% |
| Houma | 0.0 /100 | #347 | Tragic 7.9% |