Immigrants from Dominica vs Armenian Master's Degree
COMPARE
Immigrants from Dominica
Armenian
Master's Degree
Master's Degree Comparison
Immigrants from Dominica
Armenians
12.6%
MASTER'S DEGREE
0.8/ 100
METRIC RATING
253rd/ 347
METRIC RANK
16.8%
MASTER'S DEGREE
98.0/ 100
METRIC RATING
107th/ 347
METRIC RANK
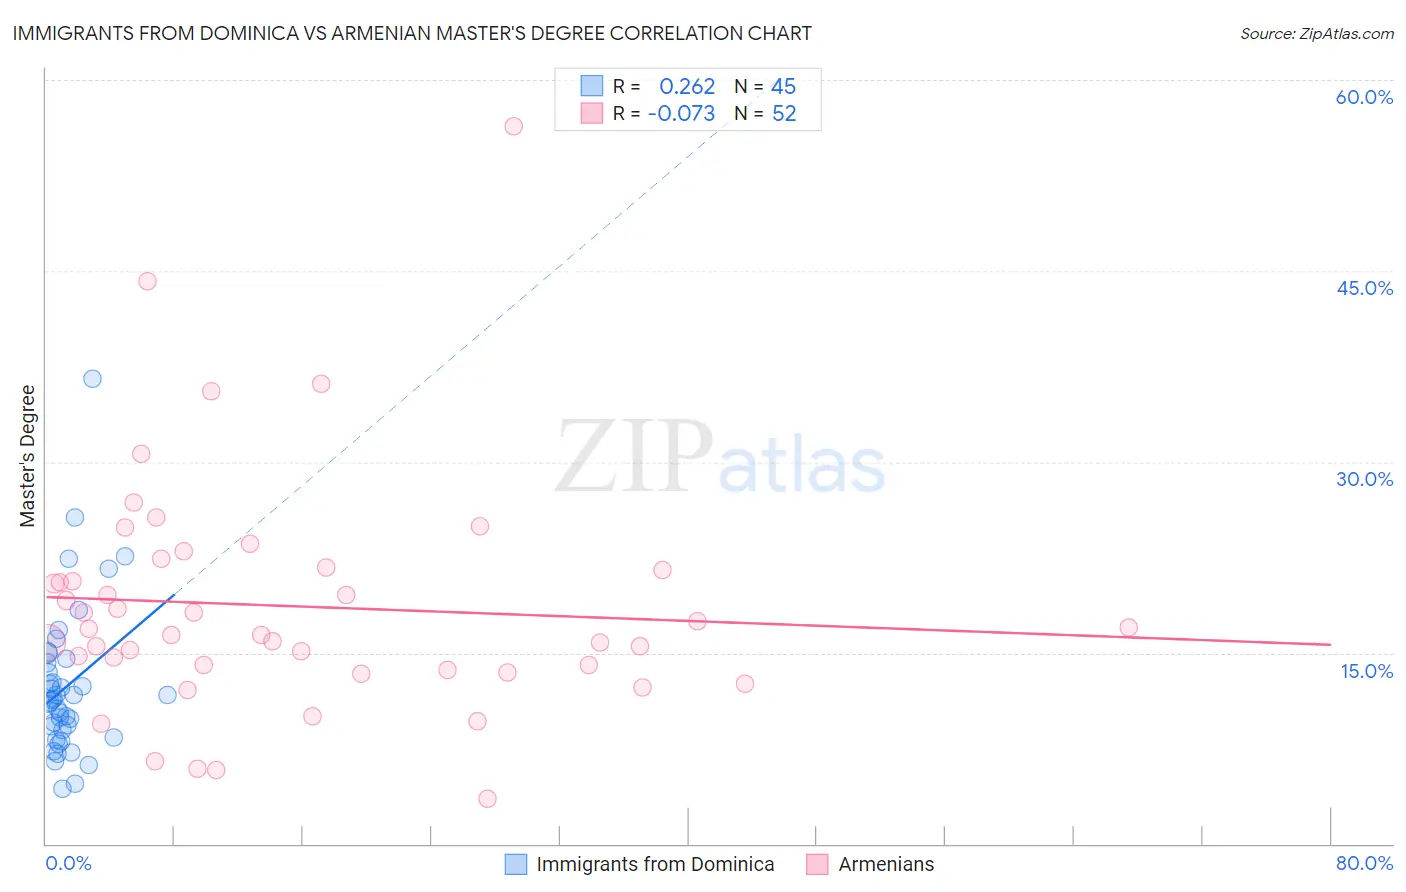
Immigrants from Dominica vs Armenian Master's Degree Correlation Chart
The statistical analysis conducted on geographies consisting of 83,792,666 people shows a weak positive correlation between the proportion of Immigrants from Dominica and percentage of population with at least master's degree education in the United States with a correlation coefficient (R) of 0.262 and weighted average of 12.6%. Similarly, the statistical analysis conducted on geographies consisting of 310,885,780 people shows a slight negative correlation between the proportion of Armenians and percentage of population with at least master's degree education in the United States with a correlation coefficient (R) of -0.073 and weighted average of 16.8%, a difference of 32.7%.
Master's Degree Correlation Summary
| Measurement | Immigrants from Dominica | Armenian |
| Minimum | 4.3% | 3.6% |
| Maximum | 36.5% | 56.3% |
| Range | 32.3% | 52.8% |
| Mean | 12.4% | 18.7% |
| Median | 11.3% | 16.7% |
| Interquartile 25% (IQ1) | 8.6% | 13.8% |
| Interquartile 75% (IQ3) | 14.4% | 21.6% |
| Interquartile Range (IQR) | 5.7% | 7.7% |
| Standard Deviation (Sample) | 6.0% | 9.3% |
| Standard Deviation (Population) | 5.9% | 9.2% |
Similar Demographics by Master's Degree
Demographics Similar to Immigrants from Dominica by Master's Degree
In terms of master's degree, the demographic groups most similar to Immigrants from Dominica are Indonesian (12.6%, a difference of 0.040%), Immigrants from Congo (12.6%, a difference of 0.070%), Immigrants from Portugal (12.6%, a difference of 0.14%), French American Indian (12.7%, a difference of 0.54%), and Osage (12.6%, a difference of 0.62%).
| Demographics | Rating | Rank | Master's Degree |
| Immigrants | Cambodia | 1.4 /100 | #246 | Tragic 12.9% |
| Iroquois | 1.4 /100 | #247 | Tragic 12.9% |
| Africans | 1.4 /100 | #248 | Tragic 12.9% |
| Cree | 1.3 /100 | #249 | Tragic 12.8% |
| Liberians | 1.3 /100 | #250 | Tragic 12.8% |
| Tlingit-Haida | 1.3 /100 | #251 | Tragic 12.8% |
| French American Indians | 1.0 /100 | #252 | Tragic 12.7% |
| Immigrants | Dominica | 0.8 /100 | #253 | Tragic 12.6% |
| Indonesians | 0.8 /100 | #254 | Tragic 12.6% |
| Immigrants | Congo | 0.8 /100 | #255 | Tragic 12.6% |
| Immigrants | Portugal | 0.8 /100 | #256 | Tragic 12.6% |
| Osage | 0.7 /100 | #257 | Tragic 12.6% |
| Immigrants | Liberia | 0.6 /100 | #258 | Tragic 12.5% |
| Japanese | 0.6 /100 | #259 | Tragic 12.5% |
| Dominicans | 0.6 /100 | #260 | Tragic 12.5% |
Demographics Similar to Armenians by Master's Degree
In terms of master's degree, the demographic groups most similar to Armenians are Sierra Leonean (16.8%, a difference of 0.030%), Moroccan (16.8%, a difference of 0.050%), Immigrants from Chile (16.8%, a difference of 0.080%), Immigrants from Albania (16.8%, a difference of 0.090%), and Austrian (16.7%, a difference of 0.35%).
| Demographics | Rating | Rank | Master's Degree |
| Albanians | 98.7 /100 | #100 | Exceptional 17.0% |
| Immigrants | Nepal | 98.6 /100 | #101 | Exceptional 17.0% |
| Chileans | 98.6 /100 | #102 | Exceptional 16.9% |
| Alsatians | 98.4 /100 | #103 | Exceptional 16.9% |
| Ukrainians | 98.3 /100 | #104 | Exceptional 16.9% |
| Syrians | 98.3 /100 | #105 | Exceptional 16.8% |
| Immigrants | Albania | 98.1 /100 | #106 | Exceptional 16.8% |
| Armenians | 98.0 /100 | #107 | Exceptional 16.8% |
| Sierra Leoneans | 98.0 /100 | #108 | Exceptional 16.8% |
| Moroccans | 98.0 /100 | #109 | Exceptional 16.8% |
| Immigrants | Chile | 98.0 /100 | #110 | Exceptional 16.8% |
| Austrians | 97.8 /100 | #111 | Exceptional 16.7% |
| Macedonians | 97.7 /100 | #112 | Exceptional 16.7% |
| Arabs | 97.7 /100 | #113 | Exceptional 16.7% |
| Northern Europeans | 97.6 /100 | #114 | Exceptional 16.7% |