Immigrants from Denmark vs Aleut Doctorate Degree
COMPARE
Immigrants from Denmark
Aleut
Doctorate Degree
Doctorate Degree Comparison
Immigrants from Denmark
Aleuts
2.8%
DOCTORATE DEGREE
100.0/ 100
METRIC RATING
23rd/ 347
METRIC RANK
1.5%
DOCTORATE DEGREE
0.4/ 100
METRIC RATING
275th/ 347
METRIC RANK
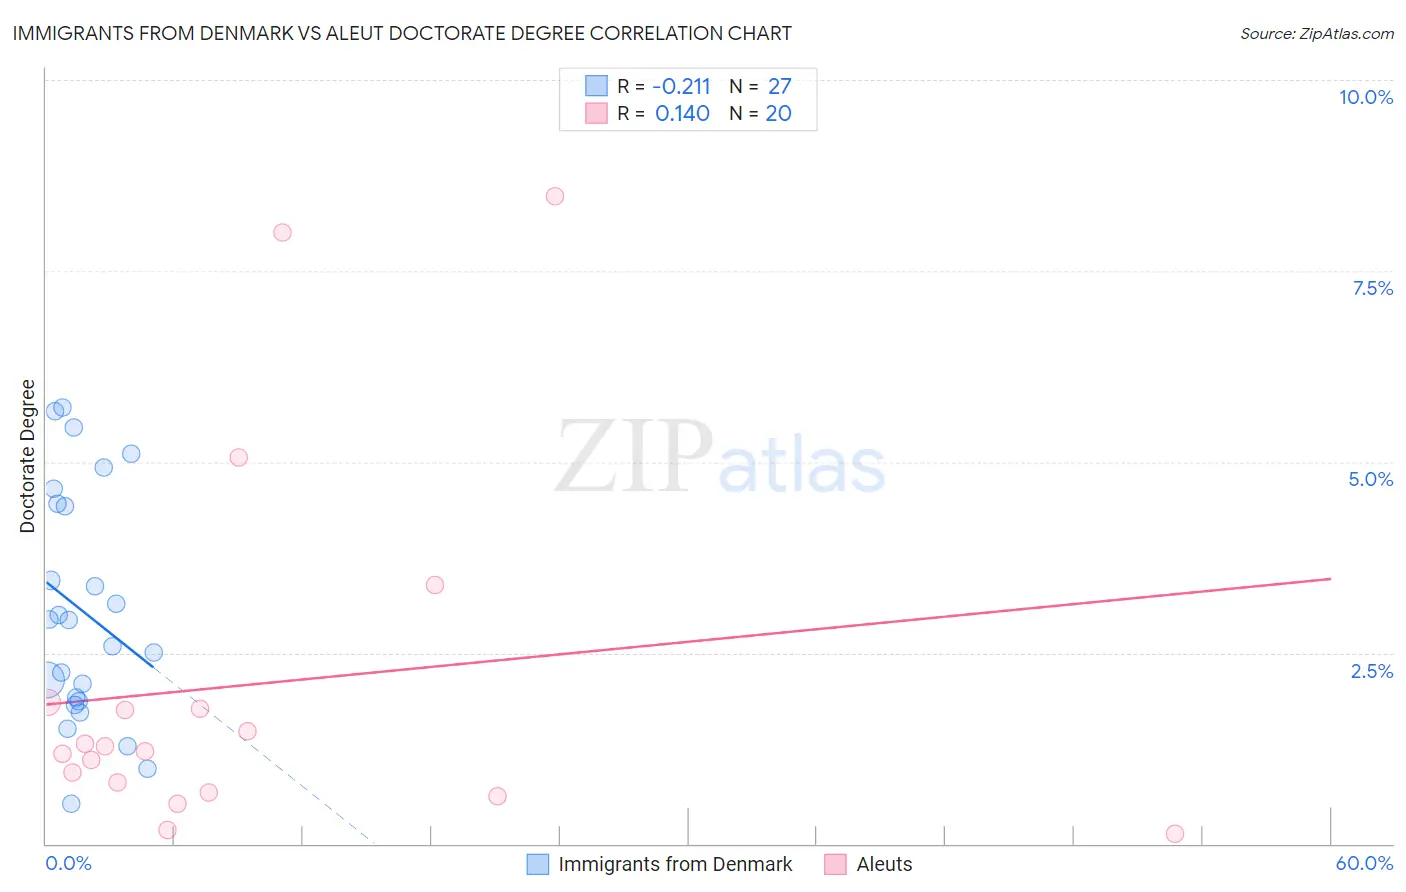
Immigrants from Denmark vs Aleut Doctorate Degree Correlation Chart
The statistical analysis conducted on geographies consisting of 136,129,405 people shows a weak negative correlation between the proportion of Immigrants from Denmark and percentage of population with at least doctorate degree education in the United States with a correlation coefficient (R) of -0.211 and weighted average of 2.8%. Similarly, the statistical analysis conducted on geographies consisting of 61,540,256 people shows a poor positive correlation between the proportion of Aleuts and percentage of population with at least doctorate degree education in the United States with a correlation coefficient (R) of 0.140 and weighted average of 1.5%, a difference of 87.3%.
Doctorate Degree Correlation Summary
| Measurement | Immigrants from Denmark | Aleut |
| Minimum | 0.53% | 0.13% |
| Maximum | 5.7% | 8.5% |
| Range | 5.2% | 8.3% |
| Mean | 3.1% | 2.1% |
| Median | 2.9% | 1.2% |
| Interquartile 25% (IQ1) | 1.9% | 0.74% |
| Interquartile 75% (IQ3) | 4.5% | 1.8% |
| Interquartile Range (IQR) | 2.6% | 1.1% |
| Standard Deviation (Sample) | 1.5% | 2.4% |
| Standard Deviation (Population) | 1.5% | 2.3% |
Similar Demographics by Doctorate Degree
Demographics Similar to Immigrants from Denmark by Doctorate Degree
In terms of doctorate degree, the demographic groups most similar to Immigrants from Denmark are Mongolian (2.8%, a difference of 0.13%), Thai (2.8%, a difference of 0.33%), Immigrants from Hong Kong (2.8%, a difference of 0.68%), Immigrants from Japan (2.8%, a difference of 1.0%), and Israeli (2.7%, a difference of 1.3%).
| Demographics | Rating | Rank | Doctorate Degree |
| Eastern Europeans | 100.0 /100 | #16 | Exceptional 2.8% |
| Immigrants | Australia | 100.0 /100 | #17 | Exceptional 2.8% |
| Immigrants | Sri Lanka | 100.0 /100 | #18 | Exceptional 2.8% |
| Immigrants | Japan | 100.0 /100 | #19 | Exceptional 2.8% |
| Immigrants | Hong Kong | 100.0 /100 | #20 | Exceptional 2.8% |
| Thais | 100.0 /100 | #21 | Exceptional 2.8% |
| Mongolians | 100.0 /100 | #22 | Exceptional 2.8% |
| Immigrants | Denmark | 100.0 /100 | #23 | Exceptional 2.8% |
| Israelis | 100.0 /100 | #24 | Exceptional 2.7% |
| Immigrants | Saudi Arabia | 100.0 /100 | #25 | Exceptional 2.7% |
| Turks | 100.0 /100 | #26 | Exceptional 2.7% |
| Immigrants | Turkey | 100.0 /100 | #27 | Exceptional 2.6% |
| Burmese | 100.0 /100 | #28 | Exceptional 2.6% |
| Immigrants | South Central Asia | 100.0 /100 | #29 | Exceptional 2.6% |
| Immigrants | Korea | 100.0 /100 | #30 | Exceptional 2.6% |
Demographics Similar to Aleuts by Doctorate Degree
In terms of doctorate degree, the demographic groups most similar to Aleuts are Paiute (1.5%, a difference of 0.050%), Yaqui (1.5%, a difference of 0.12%), Sioux (1.5%, a difference of 0.14%), Immigrants from Barbados (1.5%, a difference of 0.25%), and Immigrants from Trinidad and Tobago (1.5%, a difference of 0.34%).
| Demographics | Rating | Rank | Doctorate Degree |
| U.S. Virgin Islanders | 0.5 /100 | #268 | Tragic 1.5% |
| Crow | 0.5 /100 | #269 | Tragic 1.5% |
| Salvadorans | 0.5 /100 | #270 | Tragic 1.5% |
| Immigrants | Trinidad and Tobago | 0.5 /100 | #271 | Tragic 1.5% |
| Immigrants | Barbados | 0.4 /100 | #272 | Tragic 1.5% |
| Sioux | 0.4 /100 | #273 | Tragic 1.5% |
| Yaqui | 0.4 /100 | #274 | Tragic 1.5% |
| Aleuts | 0.4 /100 | #275 | Tragic 1.5% |
| Paiute | 0.4 /100 | #276 | Tragic 1.5% |
| Bahamians | 0.4 /100 | #277 | Tragic 1.5% |
| Hawaiians | 0.4 /100 | #278 | Tragic 1.5% |
| Marshallese | 0.4 /100 | #279 | Tragic 1.5% |
| Ecuadorians | 0.4 /100 | #280 | Tragic 1.5% |
| Tohono O'odham | 0.4 /100 | #281 | Tragic 1.5% |
| British West Indians | 0.3 /100 | #282 | Tragic 1.5% |