Immigrants from Denmark vs Eastern European 1st Grade
COMPARE
Immigrants from Denmark
Eastern European
1st Grade
1st Grade Comparison
Immigrants from Denmark
Eastern Europeans
98.3%
1ST GRADE
99.0/ 100
METRIC RATING
86th/ 347
METRIC RANK
98.5%
1ST GRADE
99.9/ 100
METRIC RATING
41st/ 347
METRIC RANK
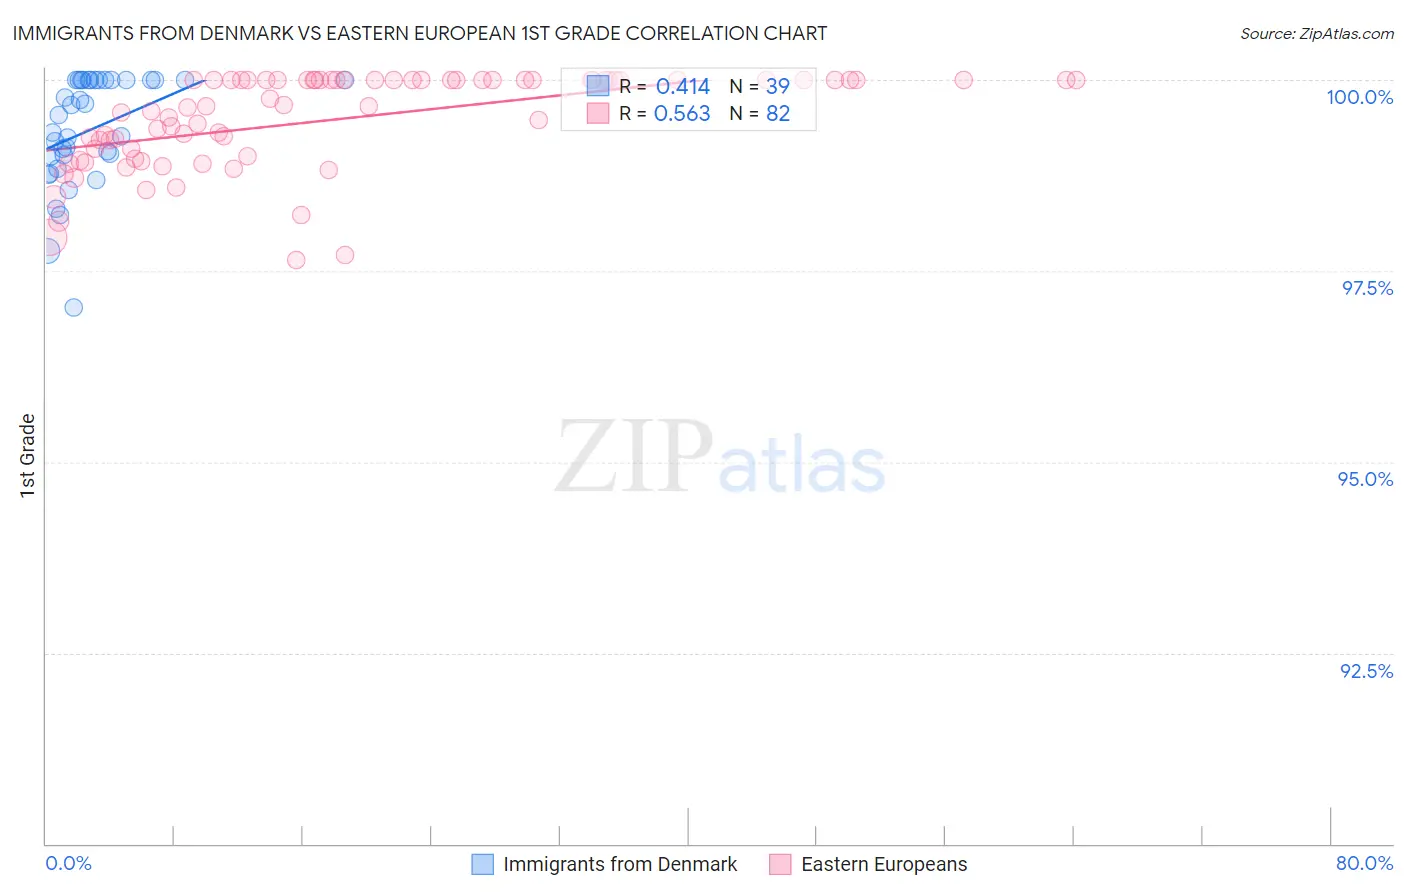
Immigrants from Denmark vs Eastern European 1st Grade Correlation Chart
The statistical analysis conducted on geographies consisting of 136,428,049 people shows a moderate positive correlation between the proportion of Immigrants from Denmark and percentage of population with at least 1st grade education in the United States with a correlation coefficient (R) of 0.414 and weighted average of 98.3%. Similarly, the statistical analysis conducted on geographies consisting of 461,247,661 people shows a substantial positive correlation between the proportion of Eastern Europeans and percentage of population with at least 1st grade education in the United States with a correlation coefficient (R) of 0.563 and weighted average of 98.5%, a difference of 0.19%.
1st Grade Correlation Summary
| Measurement | Immigrants from Denmark | Eastern European |
| Minimum | 97.0% | 97.7% |
| Maximum | 100.0% | 100.0% |
| Range | 3.0% | 2.3% |
| Mean | 99.4% | 99.5% |
| Median | 99.5% | 99.7% |
| Interquartile 25% (IQ1) | 99.0% | 99.0% |
| Interquartile 75% (IQ3) | 100.0% | 100.0% |
| Interquartile Range (IQR) | 1.0% | 1.00% |
| Standard Deviation (Sample) | 0.72% | 0.62% |
| Standard Deviation (Population) | 0.71% | 0.62% |
Similar Demographics by 1st Grade
Demographics Similar to Immigrants from Denmark by 1st Grade
In terms of 1st grade, the demographic groups most similar to Immigrants from Denmark are Immigrants from Sweden (98.3%, a difference of 0.0%), Delaware (98.3%, a difference of 0.0%), Hopi (98.3%, a difference of 0.0%), Immigrants from Australia (98.3%, a difference of 0.0%), and Immigrants from Lithuania (98.3%, a difference of 0.010%).
| Demographics | Rating | Rank | 1st Grade |
| Immigrants | Lithuania | 99.2 /100 | #79 | Exceptional 98.3% |
| Osage | 99.2 /100 | #80 | Exceptional 98.3% |
| Potawatomi | 99.1 /100 | #81 | Exceptional 98.3% |
| Icelanders | 99.1 /100 | #82 | Exceptional 98.3% |
| Immigrants | Sweden | 99.1 /100 | #83 | Exceptional 98.3% |
| Delaware | 99.1 /100 | #84 | Exceptional 98.3% |
| Hopi | 99.0 /100 | #85 | Exceptional 98.3% |
| Immigrants | Denmark | 99.0 /100 | #86 | Exceptional 98.3% |
| Immigrants | Australia | 99.0 /100 | #87 | Exceptional 98.3% |
| Zimbabweans | 98.9 /100 | #88 | Exceptional 98.3% |
| Immigrants | South Africa | 98.8 /100 | #89 | Exceptional 98.3% |
| Ukrainians | 98.8 /100 | #90 | Exceptional 98.3% |
| Immigrants | Western Europe | 98.8 /100 | #91 | Exceptional 98.3% |
| Macedonians | 98.7 /100 | #92 | Exceptional 98.3% |
| Immigrants | India | 98.6 /100 | #93 | Exceptional 98.2% |
Demographics Similar to Eastern Europeans by 1st Grade
In terms of 1st grade, the demographic groups most similar to Eastern Europeans are Luxembourger (98.5%, a difference of 0.0%), Native Hawaiian (98.5%, a difference of 0.0%), Latvian (98.5%, a difference of 0.010%), Lumbee (98.5%, a difference of 0.010%), and Northern European (98.5%, a difference of 0.010%).
| Demographics | Rating | Rank | 1st Grade |
| Swiss | 100.0 /100 | #34 | Exceptional 98.5% |
| Chinese | 100.0 /100 | #35 | Exceptional 98.5% |
| British | 100.0 /100 | #36 | Exceptional 98.5% |
| Italians | 99.9 /100 | #37 | Exceptional 98.5% |
| Chippewa | 99.9 /100 | #38 | Exceptional 98.5% |
| Latvians | 99.9 /100 | #39 | Exceptional 98.5% |
| Luxembourgers | 99.9 /100 | #40 | Exceptional 98.5% |
| Eastern Europeans | 99.9 /100 | #41 | Exceptional 98.5% |
| Native Hawaiians | 99.9 /100 | #42 | Exceptional 98.5% |
| Lumbee | 99.9 /100 | #43 | Exceptional 98.5% |
| Northern Europeans | 99.9 /100 | #44 | Exceptional 98.5% |
| Belgians | 99.9 /100 | #45 | Exceptional 98.4% |
| Hungarians | 99.9 /100 | #46 | Exceptional 98.4% |
| Ottawa | 99.8 /100 | #47 | Exceptional 98.4% |
| Czechoslovakians | 99.8 /100 | #48 | Exceptional 98.4% |