Immigrants from Cuba vs Black/African American Master's Degree
COMPARE
Immigrants from Cuba
Black/African American
Master's Degree
Master's Degree Comparison
Immigrants from Cuba
Blacks/African Americans
10.9%
MASTER'S DEGREE
0.0/ 100
METRIC RATING
318th/ 347
METRIC RANK
12.1%
MASTER'S DEGREE
0.3/ 100
METRIC RATING
276th/ 347
METRIC RANK
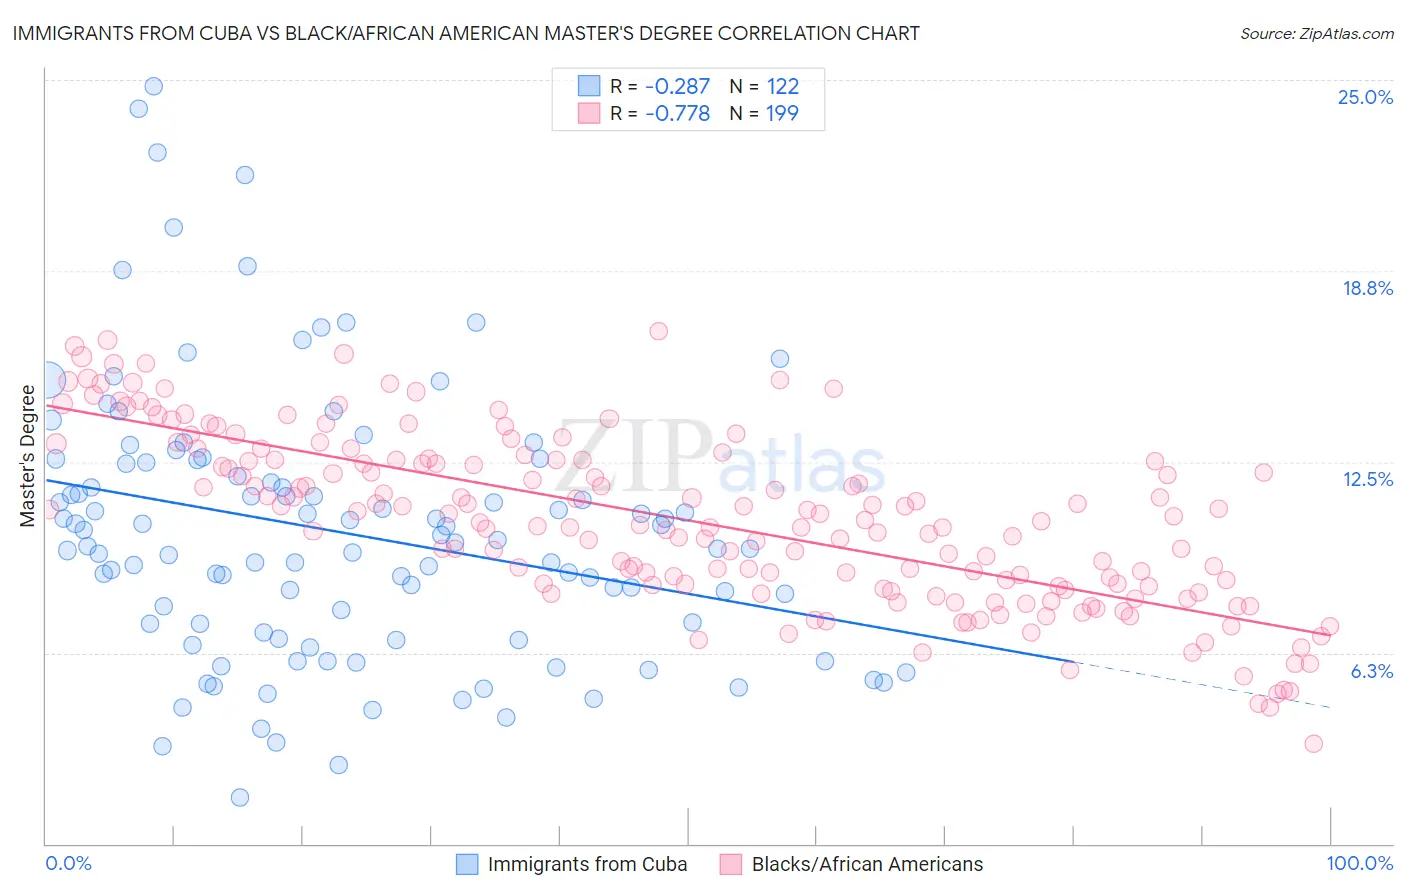
Immigrants from Cuba vs Black/African American Master's Degree Correlation Chart
The statistical analysis conducted on geographies consisting of 325,858,973 people shows a weak negative correlation between the proportion of Immigrants from Cuba and percentage of population with at least master's degree education in the United States with a correlation coefficient (R) of -0.287 and weighted average of 10.9%. Similarly, the statistical analysis conducted on geographies consisting of 563,961,779 people shows a strong negative correlation between the proportion of Blacks/African Americans and percentage of population with at least master's degree education in the United States with a correlation coefficient (R) of -0.778 and weighted average of 12.1%, a difference of 11.2%.
Master's Degree Correlation Summary
| Measurement | Immigrants from Cuba | Black/African American |
| Minimum | 1.5% | 3.3% |
| Maximum | 24.8% | 16.8% |
| Range | 23.3% | 13.5% |
| Mean | 10.2% | 10.6% |
| Median | 9.8% | 10.6% |
| Interquartile 25% (IQ1) | 6.9% | 8.4% |
| Interquartile 75% (IQ3) | 12.4% | 12.6% |
| Interquartile Range (IQR) | 5.5% | 4.1% |
| Standard Deviation (Sample) | 4.4% | 2.8% |
| Standard Deviation (Population) | 4.4% | 2.8% |
Similar Demographics by Master's Degree
Demographics Similar to Immigrants from Cuba by Master's Degree
In terms of master's degree, the demographic groups most similar to Immigrants from Cuba are Hopi (10.9%, a difference of 0.13%), Kiowa (10.8%, a difference of 0.24%), Hispanic or Latino (10.9%, a difference of 0.67%), Immigrants from Micronesia (10.8%, a difference of 0.86%), and Cajun (11.0%, a difference of 1.0%).
| Demographics | Rating | Rank | Master's Degree |
| Seminole | 0.0 /100 | #311 | Tragic 11.0% |
| Choctaw | 0.0 /100 | #312 | Tragic 11.0% |
| Yaqui | 0.0 /100 | #313 | Tragic 11.0% |
| Cajuns | 0.0 /100 | #314 | Tragic 11.0% |
| Apache | 0.0 /100 | #315 | Tragic 11.0% |
| Hispanics or Latinos | 0.0 /100 | #316 | Tragic 10.9% |
| Hopi | 0.0 /100 | #317 | Tragic 10.9% |
| Immigrants | Cuba | 0.0 /100 | #318 | Tragic 10.9% |
| Kiowa | 0.0 /100 | #319 | Tragic 10.8% |
| Immigrants | Micronesia | 0.0 /100 | #320 | Tragic 10.8% |
| Pennsylvania Germans | 0.0 /100 | #321 | Tragic 10.7% |
| Sioux | 0.0 /100 | #322 | Tragic 10.7% |
| Crow | 0.0 /100 | #323 | Tragic 10.6% |
| Dutch West Indians | 0.0 /100 | #324 | Tragic 10.6% |
| Inupiat | 0.0 /100 | #325 | Tragic 10.5% |
Demographics Similar to Blacks/African Americans by Master's Degree
In terms of master's degree, the demographic groups most similar to Blacks/African Americans are Immigrants from Caribbean (12.1%, a difference of 0.010%), Potawatomi (12.1%, a difference of 0.010%), Cuban (12.1%, a difference of 0.050%), Cape Verdean (12.1%, a difference of 0.070%), and Immigrants from Belize (12.1%, a difference of 0.090%).
| Demographics | Rating | Rank | Master's Degree |
| Central Americans | 0.3 /100 | #269 | Tragic 12.2% |
| Salvadorans | 0.3 /100 | #270 | Tragic 12.2% |
| Haitians | 0.3 /100 | #271 | Tragic 12.1% |
| Comanche | 0.3 /100 | #272 | Tragic 12.1% |
| Blackfeet | 0.3 /100 | #273 | Tragic 12.1% |
| Cape Verdeans | 0.3 /100 | #274 | Tragic 12.1% |
| Cubans | 0.3 /100 | #275 | Tragic 12.1% |
| Blacks/African Americans | 0.3 /100 | #276 | Tragic 12.1% |
| Immigrants | Caribbean | 0.3 /100 | #277 | Tragic 12.1% |
| Potawatomi | 0.3 /100 | #278 | Tragic 12.1% |
| Immigrants | Belize | 0.2 /100 | #279 | Tragic 12.1% |
| Immigrants | Dominican Republic | 0.2 /100 | #280 | Tragic 12.1% |
| Malaysians | 0.2 /100 | #281 | Tragic 12.0% |
| Immigrants | El Salvador | 0.2 /100 | #282 | Tragic 12.0% |
| Hondurans | 0.2 /100 | #283 | Tragic 11.9% |