Immigrants from Cuba vs Creek Median Family Income
COMPARE
Immigrants from Cuba
Creek
Median Family Income
Median Family Income Comparison
Immigrants from Cuba
Creek
$78,249
MEDIAN FAMILY INCOME
0.0/ 100
METRIC RATING
336th/ 347
METRIC RANK
$82,560
MEDIAN FAMILY INCOME
0.0/ 100
METRIC RATING
324th/ 347
METRIC RANK
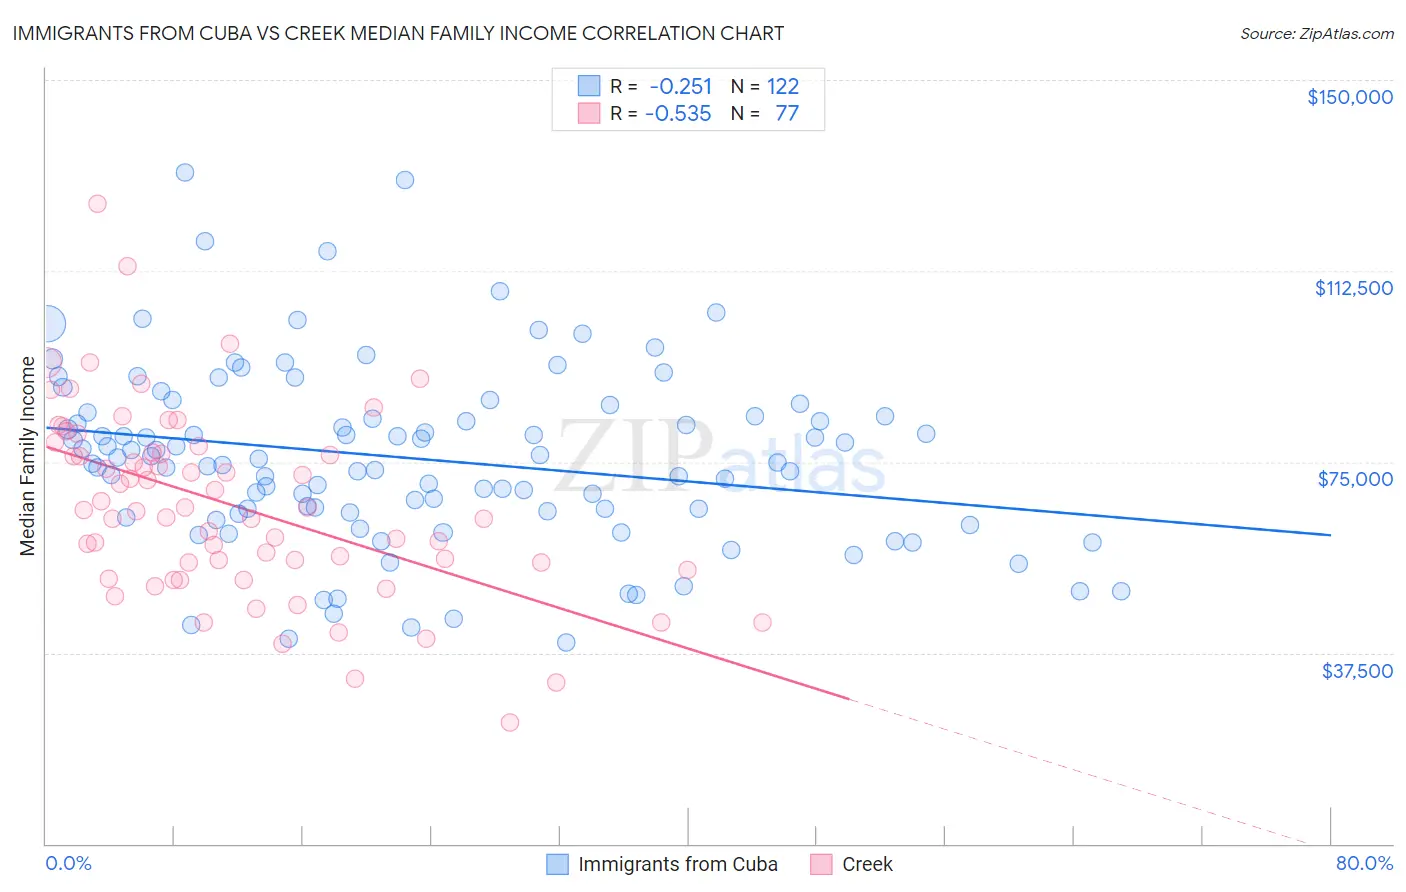
Immigrants from Cuba vs Creek Median Family Income Correlation Chart
The statistical analysis conducted on geographies consisting of 325,826,414 people shows a weak negative correlation between the proportion of Immigrants from Cuba and median family income in the United States with a correlation coefficient (R) of -0.251 and weighted average of $78,249. Similarly, the statistical analysis conducted on geographies consisting of 178,420,625 people shows a substantial negative correlation between the proportion of Creek and median family income in the United States with a correlation coefficient (R) of -0.535 and weighted average of $82,560, a difference of 5.5%.
Median Family Income Correlation Summary
| Measurement | Immigrants from Cuba | Creek |
| Minimum | $39,559 | $23,750 |
| Maximum | $131,935 | $125,671 |
| Range | $92,376 | $101,921 |
| Mean | $75,634 | $66,532 |
| Median | $75,235 | $65,440 |
| Interquartile 25% (IQ1) | $64,988 | $54,458 |
| Interquartile 75% (IQ3) | $83,903 | $77,450 |
| Interquartile Range (IQR) | $18,915 | $22,992 |
| Standard Deviation (Sample) | $17,632 | $18,322 |
| Standard Deviation (Population) | $17,559 | $18,202 |
Demographics Similar to Immigrants from Cuba and Creek by Median Family Income
In terms of median family income, the demographic groups most similar to Immigrants from Cuba are Yuman ($78,055, a difference of 0.25%), Immigrants from Yemen ($77,457, a difference of 1.0%), Pima ($77,431, a difference of 1.1%), Yup'ik ($79,290, a difference of 1.3%), and Hopi ($77,188, a difference of 1.4%). Similarly, the demographic groups most similar to Creek are Bahamian ($82,631, a difference of 0.090%), Sioux ($82,386, a difference of 0.21%), Dominican ($82,888, a difference of 0.40%), Immigrants from Congo ($82,216, a difference of 0.42%), and Arapaho ($82,064, a difference of 0.61%).
| Demographics | Rating | Rank | Median Family Income |
| Seminole | 0.0 /100 | #320 | Tragic $83,354 |
| Immigrants | Caribbean | 0.0 /100 | #321 | Tragic $83,319 |
| Dominicans | 0.0 /100 | #322 | Tragic $82,888 |
| Bahamians | 0.0 /100 | #323 | Tragic $82,631 |
| Creek | 0.0 /100 | #324 | Tragic $82,560 |
| Sioux | 0.0 /100 | #325 | Tragic $82,386 |
| Immigrants | Congo | 0.0 /100 | #326 | Tragic $82,216 |
| Arapaho | 0.0 /100 | #327 | Tragic $82,064 |
| Blacks/African Americans | 0.0 /100 | #328 | Tragic $81,912 |
| Dutch West Indians | 0.0 /100 | #329 | Tragic $81,852 |
| Cheyenne | 0.0 /100 | #330 | Tragic $81,385 |
| Immigrants | Dominican Republic | 0.0 /100 | #331 | Tragic $81,233 |
| Natives/Alaskans | 0.0 /100 | #332 | Tragic $80,908 |
| Kiowa | 0.0 /100 | #333 | Tragic $80,885 |
| Menominee | 0.0 /100 | #334 | Tragic $79,563 |
| Yup'ik | 0.0 /100 | #335 | Tragic $79,290 |
| Immigrants | Cuba | 0.0 /100 | #336 | Tragic $78,249 |
| Yuman | 0.0 /100 | #337 | Tragic $78,055 |
| Immigrants | Yemen | 0.0 /100 | #338 | Tragic $77,457 |
| Pima | 0.0 /100 | #339 | Tragic $77,431 |
| Hopi | 0.0 /100 | #340 | Tragic $77,188 |