Immigrants from Croatia vs Zimbabwean Nursery School
COMPARE
Immigrants from Croatia
Zimbabwean
Nursery School
Nursery School Comparison
Immigrants from Croatia
Zimbabweans
98.2%
NURSERY SCHOOL
91.4/ 100
METRIC RATING
130th/ 347
METRIC RANK
98.3%
NURSERY SCHOOL
98.8/ 100
METRIC RATING
91st/ 347
METRIC RANK
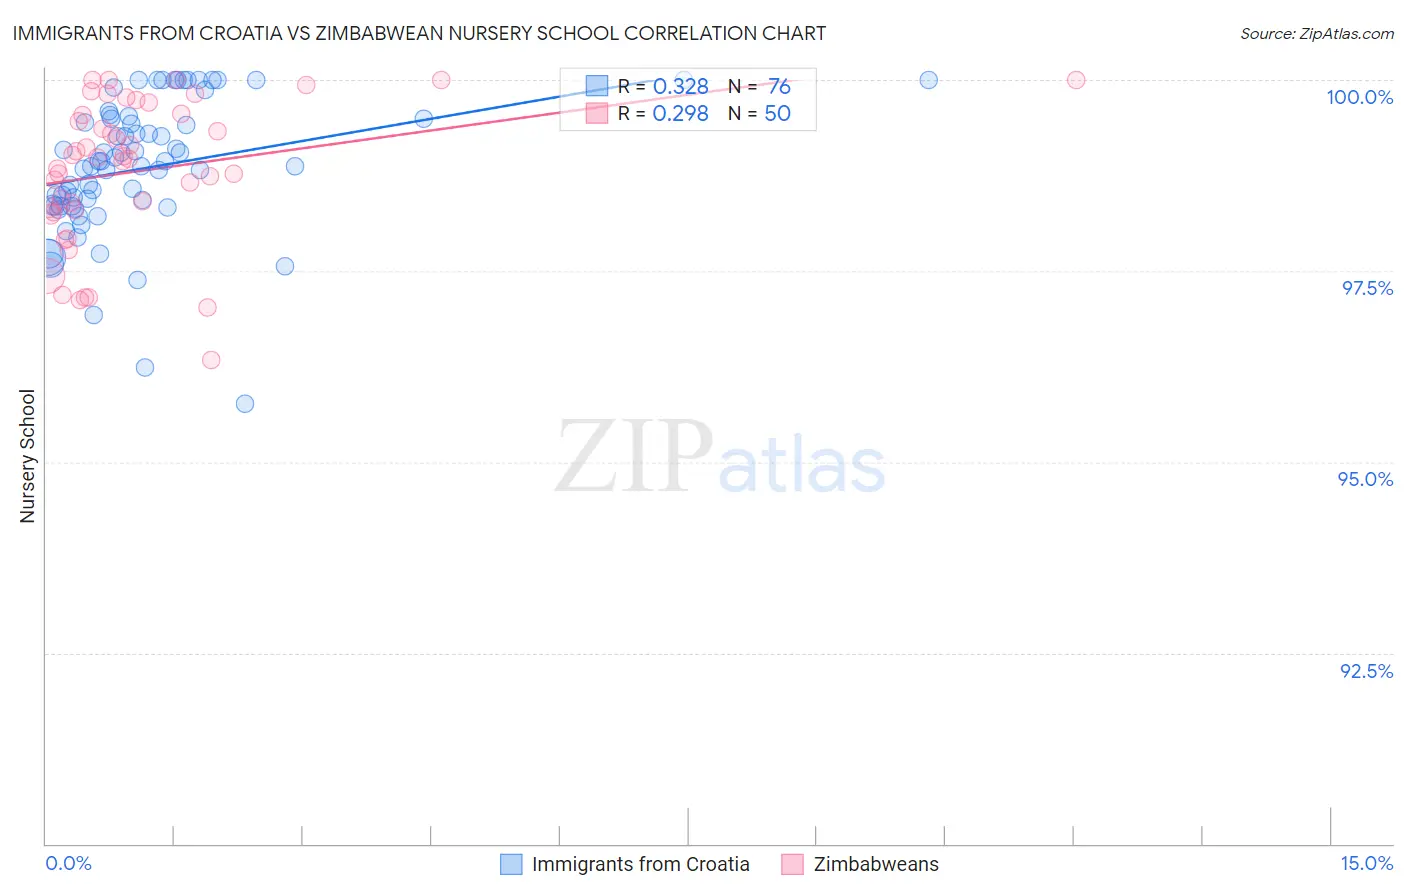
Immigrants from Croatia vs Zimbabwean Nursery School Correlation Chart
The statistical analysis conducted on geographies consisting of 132,538,077 people shows a mild positive correlation between the proportion of Immigrants from Croatia and percentage of population with at least nursery school education in the United States with a correlation coefficient (R) of 0.328 and weighted average of 98.2%. Similarly, the statistical analysis conducted on geographies consisting of 69,200,462 people shows a weak positive correlation between the proportion of Zimbabweans and percentage of population with at least nursery school education in the United States with a correlation coefficient (R) of 0.298 and weighted average of 98.3%, a difference of 0.15%.
Nursery School Correlation Summary
| Measurement | Immigrants from Croatia | Zimbabwean |
| Minimum | 95.8% | 96.3% |
| Maximum | 100.0% | 100.0% |
| Range | 4.2% | 3.7% |
| Mean | 98.9% | 98.8% |
| Median | 98.9% | 99.0% |
| Interquartile 25% (IQ1) | 98.4% | 98.3% |
| Interquartile 75% (IQ3) | 99.5% | 99.6% |
| Interquartile Range (IQR) | 1.1% | 1.3% |
| Standard Deviation (Sample) | 0.89% | 0.94% |
| Standard Deviation (Population) | 0.88% | 0.93% |
Similar Demographics by Nursery School
Demographics Similar to Immigrants from Croatia by Nursery School
In terms of nursery school, the demographic groups most similar to Immigrants from Croatia are Cambodian (98.2%, a difference of 0.0%), Spaniard (98.2%, a difference of 0.0%), Seminole (98.2%, a difference of 0.0%), Immigrants from Serbia (98.2%, a difference of 0.010%), and Immigrants from Europe (98.1%, a difference of 0.010%).
| Demographics | Rating | Rank | Nursery School |
| Syrians | 93.9 /100 | #123 | Exceptional 98.2% |
| Lebanese | 93.8 /100 | #124 | Exceptional 98.2% |
| Iroquois | 93.7 /100 | #125 | Exceptional 98.2% |
| Menominee | 93.6 /100 | #126 | Exceptional 98.2% |
| Immigrants | Saudi Arabia | 93.4 /100 | #127 | Exceptional 98.2% |
| Immigrants | Serbia | 92.4 /100 | #128 | Exceptional 98.2% |
| Cambodians | 91.4 /100 | #129 | Exceptional 98.2% |
| Immigrants | Croatia | 91.4 /100 | #130 | Exceptional 98.2% |
| Spaniards | 91.1 /100 | #131 | Exceptional 98.2% |
| Seminole | 90.9 /100 | #132 | Exceptional 98.2% |
| Immigrants | Europe | 90.7 /100 | #133 | Exceptional 98.1% |
| Immigrants | Bulgaria | 89.4 /100 | #134 | Excellent 98.1% |
| Immigrants | Hungary | 89.3 /100 | #135 | Excellent 98.1% |
| Immigrants | Kuwait | 88.9 /100 | #136 | Excellent 98.1% |
| Israelis | 88.2 /100 | #137 | Excellent 98.1% |
Demographics Similar to Zimbabweans by Nursery School
In terms of nursery school, the demographic groups most similar to Zimbabweans are Hopi (98.3%, a difference of 0.0%), Ukrainian (98.3%, a difference of 0.0%), Immigrants from South Africa (98.3%, a difference of 0.0%), Immigrants from Western Europe (98.3%, a difference of 0.0%), and Macedonian (98.3%, a difference of 0.0%).
| Demographics | Rating | Rank | Nursery School |
| Immigrants | Denmark | 99.1 /100 | #84 | Exceptional 98.3% |
| Immigrants | Sweden | 99.1 /100 | #85 | Exceptional 98.3% |
| Immigrants | Australia | 99.0 /100 | #86 | Exceptional 98.3% |
| Hopi | 98.9 /100 | #87 | Exceptional 98.3% |
| Ukrainians | 98.9 /100 | #88 | Exceptional 98.3% |
| Immigrants | South Africa | 98.8 /100 | #89 | Exceptional 98.3% |
| Immigrants | Western Europe | 98.8 /100 | #90 | Exceptional 98.3% |
| Zimbabweans | 98.8 /100 | #91 | Exceptional 98.3% |
| Macedonians | 98.7 /100 | #92 | Exceptional 98.3% |
| Immigrants | India | 98.7 /100 | #93 | Exceptional 98.3% |
| Immigrants | Germany | 98.6 /100 | #94 | Exceptional 98.3% |
| South Africans | 98.6 /100 | #95 | Exceptional 98.3% |
| Cypriots | 98.3 /100 | #96 | Exceptional 98.3% |
| Immigrants | Nonimmigrants | 98.3 /100 | #97 | Exceptional 98.3% |
| Choctaw | 98.3 /100 | #98 | Exceptional 98.3% |