Immigrants from Croatia vs Austrian Nursery School
COMPARE
Immigrants from Croatia
Austrian
Nursery School
Nursery School Comparison
Immigrants from Croatia
Austrians
98.2%
NURSERY SCHOOL
91.4/ 100
METRIC RATING
130th/ 347
METRIC RANK
98.4%
NURSERY SCHOOL
99.8/ 100
METRIC RATING
57th/ 347
METRIC RANK
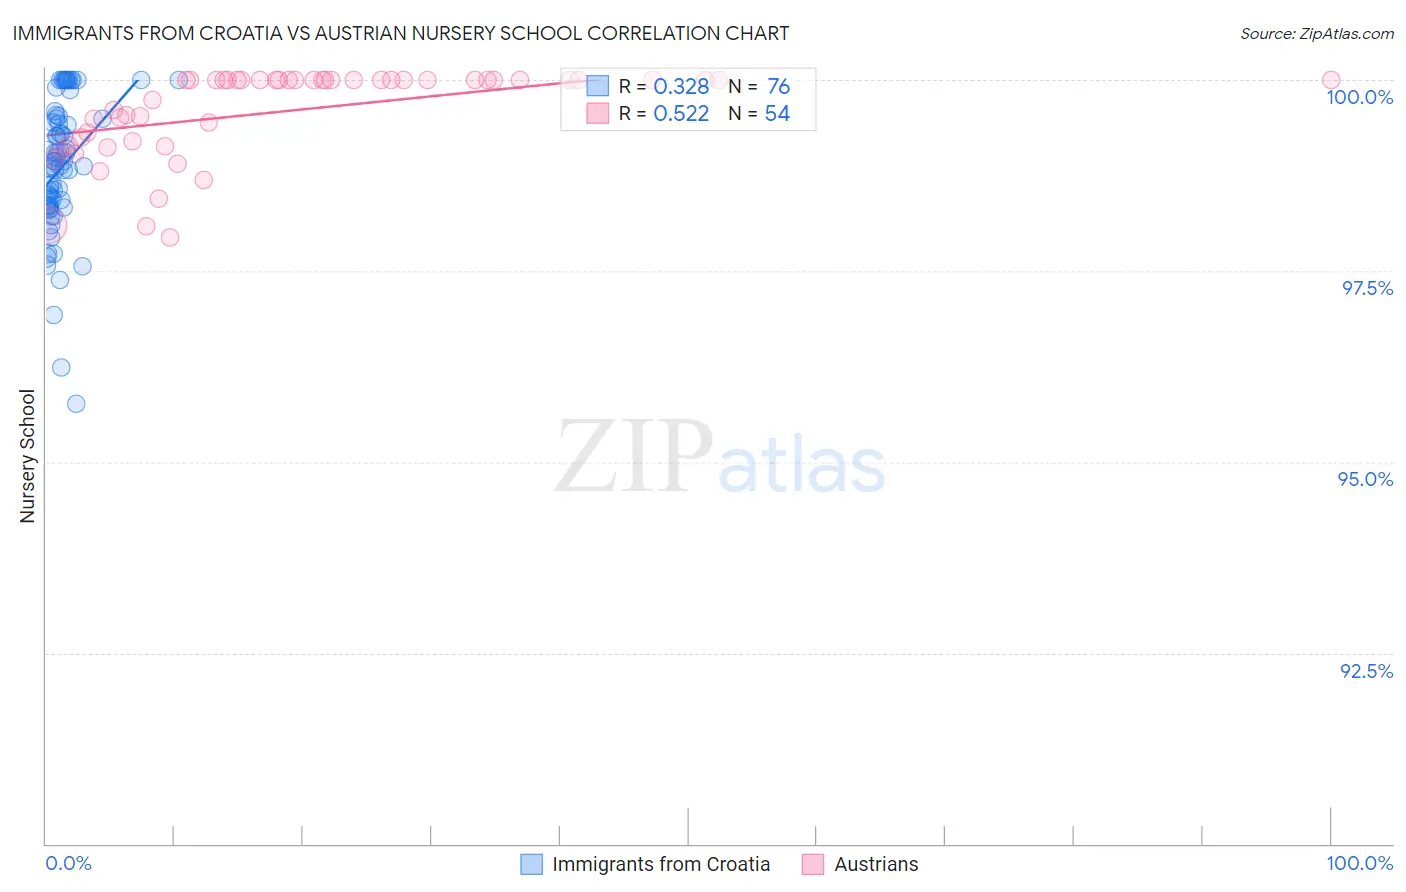
Immigrants from Croatia vs Austrian Nursery School Correlation Chart
The statistical analysis conducted on geographies consisting of 132,538,077 people shows a mild positive correlation between the proportion of Immigrants from Croatia and percentage of population with at least nursery school education in the United States with a correlation coefficient (R) of 0.328 and weighted average of 98.2%. Similarly, the statistical analysis conducted on geographies consisting of 452,080,536 people shows a substantial positive correlation between the proportion of Austrians and percentage of population with at least nursery school education in the United States with a correlation coefficient (R) of 0.522 and weighted average of 98.4%, a difference of 0.28%.
Nursery School Correlation Summary
| Measurement | Immigrants from Croatia | Austrian |
| Minimum | 95.8% | 97.9% |
| Maximum | 100.0% | 100.0% |
| Range | 4.2% | 2.1% |
| Mean | 98.9% | 99.6% |
| Median | 98.9% | 100.0% |
| Interquartile 25% (IQ1) | 98.4% | 99.2% |
| Interquartile 75% (IQ3) | 99.5% | 100.0% |
| Interquartile Range (IQR) | 1.1% | 0.81% |
| Standard Deviation (Sample) | 0.89% | 0.58% |
| Standard Deviation (Population) | 0.88% | 0.57% |
Similar Demographics by Nursery School
Demographics Similar to Immigrants from Croatia by Nursery School
In terms of nursery school, the demographic groups most similar to Immigrants from Croatia are Cambodian (98.2%, a difference of 0.0%), Spaniard (98.2%, a difference of 0.0%), Seminole (98.2%, a difference of 0.0%), Immigrants from Serbia (98.2%, a difference of 0.010%), and Immigrants from Europe (98.1%, a difference of 0.010%).
| Demographics | Rating | Rank | Nursery School |
| Syrians | 93.9 /100 | #123 | Exceptional 98.2% |
| Lebanese | 93.8 /100 | #124 | Exceptional 98.2% |
| Iroquois | 93.7 /100 | #125 | Exceptional 98.2% |
| Menominee | 93.6 /100 | #126 | Exceptional 98.2% |
| Immigrants | Saudi Arabia | 93.4 /100 | #127 | Exceptional 98.2% |
| Immigrants | Serbia | 92.4 /100 | #128 | Exceptional 98.2% |
| Cambodians | 91.4 /100 | #129 | Exceptional 98.2% |
| Immigrants | Croatia | 91.4 /100 | #130 | Exceptional 98.2% |
| Spaniards | 91.1 /100 | #131 | Exceptional 98.2% |
| Seminole | 90.9 /100 | #132 | Exceptional 98.2% |
| Immigrants | Europe | 90.7 /100 | #133 | Exceptional 98.1% |
| Immigrants | Bulgaria | 89.4 /100 | #134 | Excellent 98.1% |
| Immigrants | Hungary | 89.3 /100 | #135 | Excellent 98.1% |
| Immigrants | Kuwait | 88.9 /100 | #136 | Excellent 98.1% |
| Israelis | 88.2 /100 | #137 | Excellent 98.1% |
Demographics Similar to Austrians by Nursery School
In terms of nursery school, the demographic groups most similar to Austrians are American (98.4%, a difference of 0.0%), Bulgarian (98.4%, a difference of 0.0%), Pueblo (98.4%, a difference of 0.010%), Immigrants from Scotland (98.4%, a difference of 0.010%), and Immigrants from Canada (98.4%, a difference of 0.010%).
| Demographics | Rating | Rank | Nursery School |
| Celtics | 99.8 /100 | #50 | Exceptional 98.5% |
| Estonians | 99.8 /100 | #51 | Exceptional 98.5% |
| Australians | 99.8 /100 | #52 | Exceptional 98.5% |
| Kiowa | 99.8 /100 | #53 | Exceptional 98.4% |
| Pueblo | 99.8 /100 | #54 | Exceptional 98.4% |
| Immigrants | Scotland | 99.8 /100 | #55 | Exceptional 98.4% |
| Americans | 99.8 /100 | #56 | Exceptional 98.4% |
| Austrians | 99.8 /100 | #57 | Exceptional 98.4% |
| Bulgarians | 99.8 /100 | #58 | Exceptional 98.4% |
| Immigrants | Canada | 99.8 /100 | #59 | Exceptional 98.4% |
| Slavs | 99.8 /100 | #60 | Exceptional 98.4% |
| New Zealanders | 99.7 /100 | #61 | Exceptional 98.4% |
| Creek | 99.7 /100 | #62 | Exceptional 98.4% |
| Immigrants | North America | 99.7 /100 | #63 | Exceptional 98.4% |
| Greeks | 99.7 /100 | #64 | Exceptional 98.4% |