Celtic vs Zimbabwean Nursery School
COMPARE
Celtic
Zimbabwean
Nursery School
Nursery School Comparison
Celtics
Zimbabweans
98.5%
NURSERY SCHOOL
99.8/ 100
METRIC RATING
50th/ 347
METRIC RANK
98.3%
NURSERY SCHOOL
98.8/ 100
METRIC RATING
91st/ 347
METRIC RANK
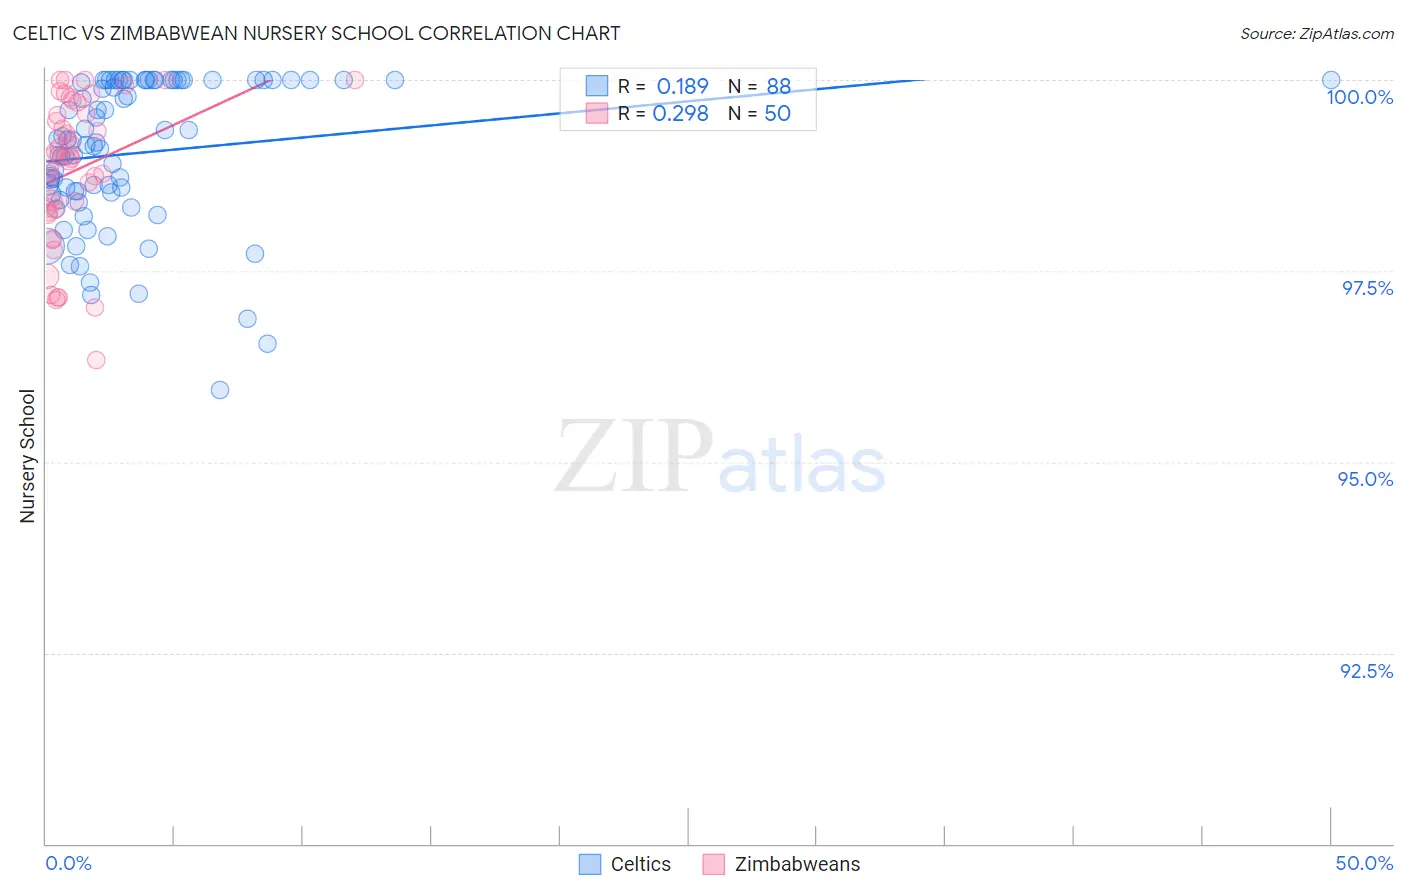
Celtic vs Zimbabwean Nursery School Correlation Chart
The statistical analysis conducted on geographies consisting of 168,875,705 people shows a poor positive correlation between the proportion of Celtics and percentage of population with at least nursery school education in the United States with a correlation coefficient (R) of 0.189 and weighted average of 98.5%. Similarly, the statistical analysis conducted on geographies consisting of 69,200,462 people shows a weak positive correlation between the proportion of Zimbabweans and percentage of population with at least nursery school education in the United States with a correlation coefficient (R) of 0.298 and weighted average of 98.3%, a difference of 0.15%.
Nursery School Correlation Summary
| Measurement | Celtic | Zimbabwean |
| Minimum | 95.9% | 96.3% |
| Maximum | 100.0% | 100.0% |
| Range | 4.1% | 3.7% |
| Mean | 99.0% | 98.8% |
| Median | 99.2% | 99.0% |
| Interquartile 25% (IQ1) | 98.5% | 98.3% |
| Interquartile 75% (IQ3) | 100.0% | 99.6% |
| Interquartile Range (IQR) | 1.5% | 1.3% |
| Standard Deviation (Sample) | 0.96% | 0.94% |
| Standard Deviation (Population) | 0.95% | 0.93% |
Similar Demographics by Nursery School
Demographics Similar to Celtics by Nursery School
In terms of nursery school, the demographic groups most similar to Celtics are Ottawa (98.5%, a difference of 0.0%), White/Caucasian (98.5%, a difference of 0.0%), Estonian (98.5%, a difference of 0.0%), Australian (98.5%, a difference of 0.0%), and Czechoslovakian (98.5%, a difference of 0.010%).
| Demographics | Rating | Rank | Nursery School |
| Native Hawaiians | 99.9 /100 | #43 | Exceptional 98.5% |
| Belgians | 99.9 /100 | #44 | Exceptional 98.5% |
| Northern Europeans | 99.9 /100 | #45 | Exceptional 98.5% |
| Hungarians | 99.9 /100 | #46 | Exceptional 98.5% |
| Czechoslovakians | 99.9 /100 | #47 | Exceptional 98.5% |
| Ottawa | 99.8 /100 | #48 | Exceptional 98.5% |
| Whites/Caucasians | 99.8 /100 | #49 | Exceptional 98.5% |
| Celtics | 99.8 /100 | #50 | Exceptional 98.5% |
| Estonians | 99.8 /100 | #51 | Exceptional 98.5% |
| Australians | 99.8 /100 | #52 | Exceptional 98.5% |
| Kiowa | 99.8 /100 | #53 | Exceptional 98.4% |
| Pueblo | 99.8 /100 | #54 | Exceptional 98.4% |
| Immigrants | Scotland | 99.8 /100 | #55 | Exceptional 98.4% |
| Americans | 99.8 /100 | #56 | Exceptional 98.4% |
| Austrians | 99.8 /100 | #57 | Exceptional 98.4% |
Demographics Similar to Zimbabweans by Nursery School
In terms of nursery school, the demographic groups most similar to Zimbabweans are Hopi (98.3%, a difference of 0.0%), Ukrainian (98.3%, a difference of 0.0%), Immigrants from South Africa (98.3%, a difference of 0.0%), Immigrants from Western Europe (98.3%, a difference of 0.0%), and Macedonian (98.3%, a difference of 0.0%).
| Demographics | Rating | Rank | Nursery School |
| Immigrants | Denmark | 99.1 /100 | #84 | Exceptional 98.3% |
| Immigrants | Sweden | 99.1 /100 | #85 | Exceptional 98.3% |
| Immigrants | Australia | 99.0 /100 | #86 | Exceptional 98.3% |
| Hopi | 98.9 /100 | #87 | Exceptional 98.3% |
| Ukrainians | 98.9 /100 | #88 | Exceptional 98.3% |
| Immigrants | South Africa | 98.8 /100 | #89 | Exceptional 98.3% |
| Immigrants | Western Europe | 98.8 /100 | #90 | Exceptional 98.3% |
| Zimbabweans | 98.8 /100 | #91 | Exceptional 98.3% |
| Macedonians | 98.7 /100 | #92 | Exceptional 98.3% |
| Immigrants | India | 98.7 /100 | #93 | Exceptional 98.3% |
| Immigrants | Germany | 98.6 /100 | #94 | Exceptional 98.3% |
| South Africans | 98.6 /100 | #95 | Exceptional 98.3% |
| Cypriots | 98.3 /100 | #96 | Exceptional 98.3% |
| Immigrants | Nonimmigrants | 98.3 /100 | #97 | Exceptional 98.3% |
| Choctaw | 98.3 /100 | #98 | Exceptional 98.3% |