Immigrants from Bosnia and Herzegovina vs Zimbabwean Nursery School
COMPARE
Immigrants from Bosnia and Herzegovina
Zimbabwean
Nursery School
Nursery School Comparison
Immigrants from Bosnia and Herzegovina
Zimbabweans
98.0%
NURSERY SCHOOL
45.6/ 100
METRIC RATING
180th/ 347
METRIC RANK
98.3%
NURSERY SCHOOL
98.8/ 100
METRIC RATING
91st/ 347
METRIC RANK
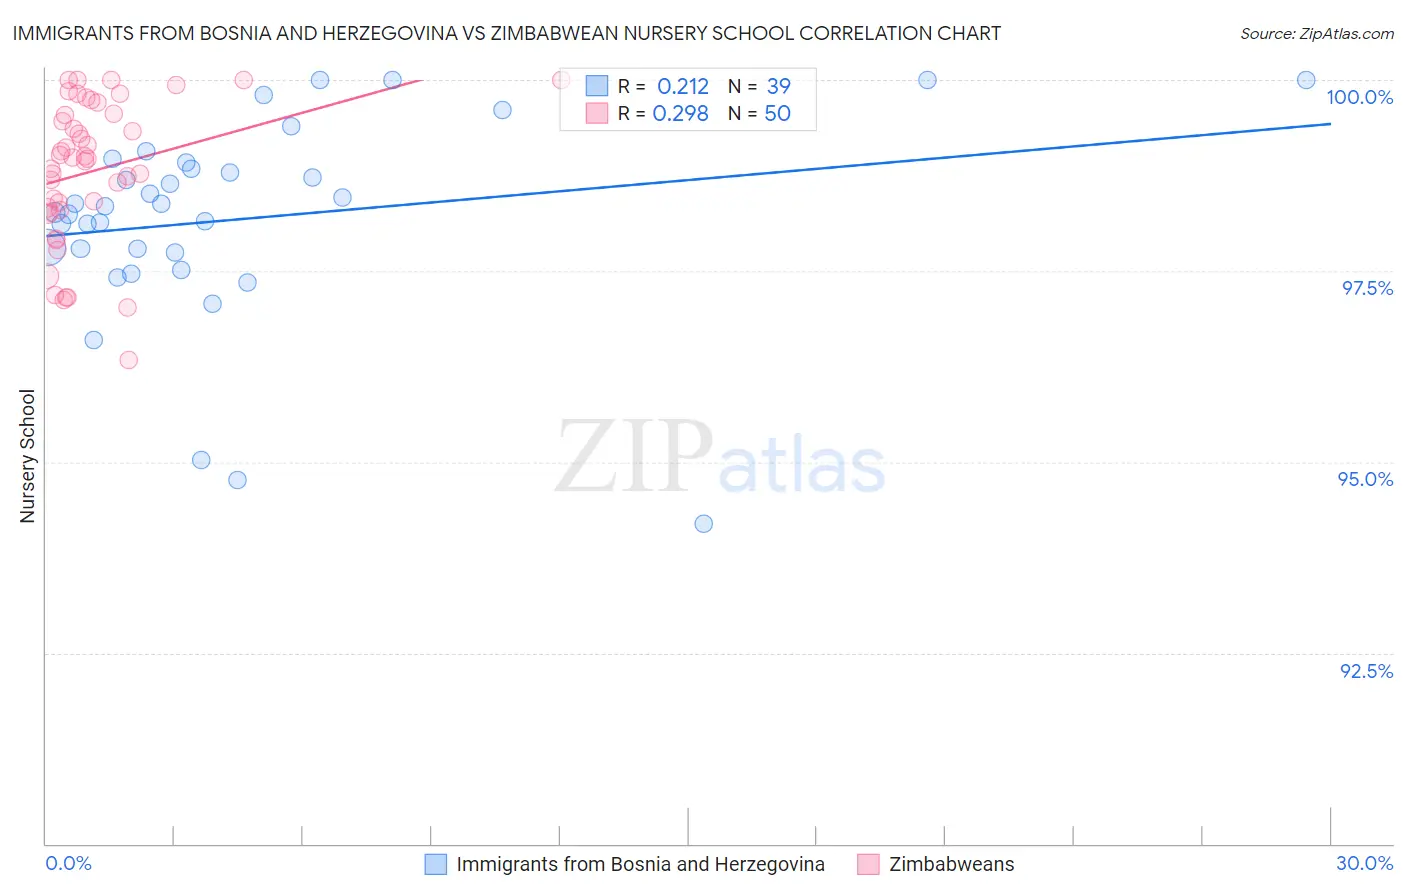
Immigrants from Bosnia and Herzegovina vs Zimbabwean Nursery School Correlation Chart
The statistical analysis conducted on geographies consisting of 156,779,463 people shows a weak positive correlation between the proportion of Immigrants from Bosnia and Herzegovina and percentage of population with at least nursery school education in the United States with a correlation coefficient (R) of 0.212 and weighted average of 98.0%. Similarly, the statistical analysis conducted on geographies consisting of 69,200,462 people shows a weak positive correlation between the proportion of Zimbabweans and percentage of population with at least nursery school education in the United States with a correlation coefficient (R) of 0.298 and weighted average of 98.3%, a difference of 0.34%.
Nursery School Correlation Summary
| Measurement | Immigrants from Bosnia and Herzegovina | Zimbabwean |
| Minimum | 94.2% | 96.3% |
| Maximum | 100.0% | 100.0% |
| Range | 5.8% | 3.7% |
| Mean | 98.2% | 98.8% |
| Median | 98.3% | 99.0% |
| Interquartile 25% (IQ1) | 97.7% | 98.3% |
| Interquartile 75% (IQ3) | 98.9% | 99.6% |
| Interquartile Range (IQR) | 1.2% | 1.3% |
| Standard Deviation (Sample) | 1.3% | 0.94% |
| Standard Deviation (Population) | 1.3% | 0.93% |
Similar Demographics by Nursery School
Demographics Similar to Immigrants from Bosnia and Herzegovina by Nursery School
In terms of nursery school, the demographic groups most similar to Immigrants from Bosnia and Herzegovina are Argentinean (98.0%, a difference of 0.0%), Kenyan (98.0%, a difference of 0.010%), Navajo (98.0%, a difference of 0.010%), Immigrants from Sri Lanka (98.0%, a difference of 0.010%), and Immigrants from Venezuela (98.0%, a difference of 0.010%).
| Demographics | Rating | Rank | Nursery School |
| Kenyans | 50.2 /100 | #173 | Average 98.0% |
| Navajo | 50.0 /100 | #174 | Average 98.0% |
| Immigrants | Sri Lanka | 49.9 /100 | #175 | Average 98.0% |
| Immigrants | Venezuela | 49.8 /100 | #176 | Average 98.0% |
| Albanians | 48.9 /100 | #177 | Average 98.0% |
| Natives/Alaskans | 48.6 /100 | #178 | Average 98.0% |
| Argentineans | 46.8 /100 | #179 | Average 98.0% |
| Immigrants | Bosnia and Herzegovina | 45.6 /100 | #180 | Average 98.0% |
| Egyptians | 42.8 /100 | #181 | Average 98.0% |
| Paiute | 42.0 /100 | #182 | Average 98.0% |
| Portuguese | 41.8 /100 | #183 | Average 98.0% |
| Immigrants | Poland | 41.3 /100 | #184 | Average 98.0% |
| Immigrants | Belarus | 41.0 /100 | #185 | Average 98.0% |
| Immigrants | Argentina | 40.8 /100 | #186 | Average 98.0% |
| Immigrants | Kazakhstan | 37.1 /100 | #187 | Fair 97.9% |
Demographics Similar to Zimbabweans by Nursery School
In terms of nursery school, the demographic groups most similar to Zimbabweans are Hopi (98.3%, a difference of 0.0%), Ukrainian (98.3%, a difference of 0.0%), Immigrants from South Africa (98.3%, a difference of 0.0%), Immigrants from Western Europe (98.3%, a difference of 0.0%), and Macedonian (98.3%, a difference of 0.0%).
| Demographics | Rating | Rank | Nursery School |
| Immigrants | Denmark | 99.1 /100 | #84 | Exceptional 98.3% |
| Immigrants | Sweden | 99.1 /100 | #85 | Exceptional 98.3% |
| Immigrants | Australia | 99.0 /100 | #86 | Exceptional 98.3% |
| Hopi | 98.9 /100 | #87 | Exceptional 98.3% |
| Ukrainians | 98.9 /100 | #88 | Exceptional 98.3% |
| Immigrants | South Africa | 98.8 /100 | #89 | Exceptional 98.3% |
| Immigrants | Western Europe | 98.8 /100 | #90 | Exceptional 98.3% |
| Zimbabweans | 98.8 /100 | #91 | Exceptional 98.3% |
| Macedonians | 98.7 /100 | #92 | Exceptional 98.3% |
| Immigrants | India | 98.7 /100 | #93 | Exceptional 98.3% |
| Immigrants | Germany | 98.6 /100 | #94 | Exceptional 98.3% |
| South Africans | 98.6 /100 | #95 | Exceptional 98.3% |
| Cypriots | 98.3 /100 | #96 | Exceptional 98.3% |
| Immigrants | Nonimmigrants | 98.3 /100 | #97 | Exceptional 98.3% |
| Choctaw | 98.3 /100 | #98 | Exceptional 98.3% |