Immigrants from Croatia vs Laotian Nursery School
COMPARE
Immigrants from Croatia
Laotian
Nursery School
Nursery School Comparison
Immigrants from Croatia
Laotians
98.2%
NURSERY SCHOOL
91.4/ 100
METRIC RATING
130th/ 347
METRIC RANK
97.8%
NURSERY SCHOOL
9.8/ 100
METRIC RATING
211th/ 347
METRIC RANK
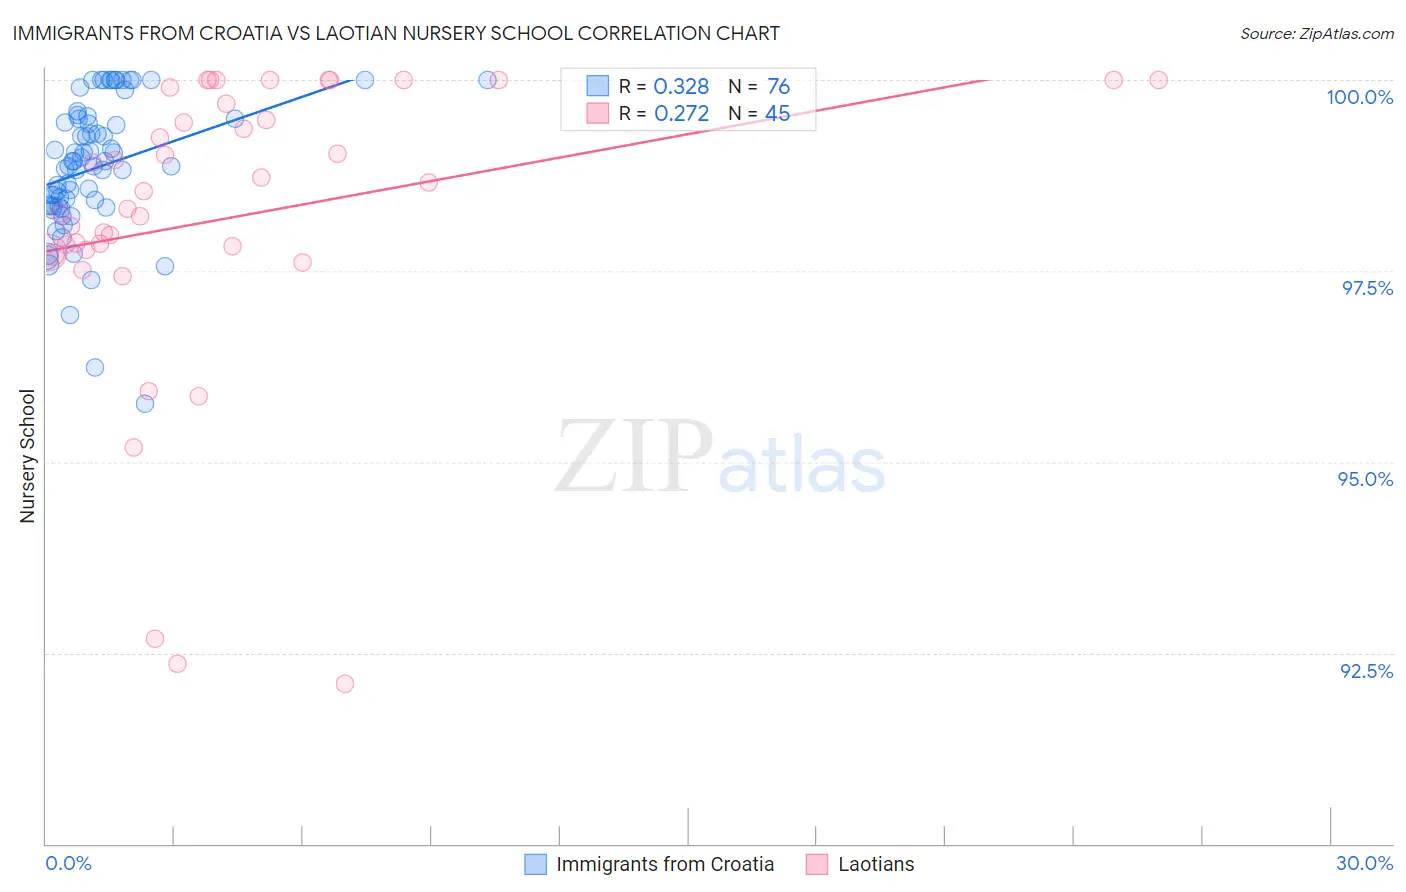
Immigrants from Croatia vs Laotian Nursery School Correlation Chart
The statistical analysis conducted on geographies consisting of 132,538,077 people shows a mild positive correlation between the proportion of Immigrants from Croatia and percentage of population with at least nursery school education in the United States with a correlation coefficient (R) of 0.328 and weighted average of 98.2%. Similarly, the statistical analysis conducted on geographies consisting of 224,863,064 people shows a weak positive correlation between the proportion of Laotians and percentage of population with at least nursery school education in the United States with a correlation coefficient (R) of 0.272 and weighted average of 97.8%, a difference of 0.34%.
Nursery School Correlation Summary
| Measurement | Immigrants from Croatia | Laotian |
| Minimum | 95.8% | 92.1% |
| Maximum | 100.0% | 100.0% |
| Range | 4.2% | 7.9% |
| Mean | 98.9% | 98.2% |
| Median | 98.9% | 98.5% |
| Interquartile 25% (IQ1) | 98.4% | 97.8% |
| Interquartile 75% (IQ3) | 99.5% | 99.8% |
| Interquartile Range (IQR) | 1.1% | 2.0% |
| Standard Deviation (Sample) | 0.89% | 2.0% |
| Standard Deviation (Population) | 0.88% | 1.9% |
Similar Demographics by Nursery School
Demographics Similar to Immigrants from Croatia by Nursery School
In terms of nursery school, the demographic groups most similar to Immigrants from Croatia are Cambodian (98.2%, a difference of 0.0%), Spaniard (98.2%, a difference of 0.0%), Seminole (98.2%, a difference of 0.0%), Immigrants from Serbia (98.2%, a difference of 0.010%), and Immigrants from Europe (98.1%, a difference of 0.010%).
| Demographics | Rating | Rank | Nursery School |
| Syrians | 93.9 /100 | #123 | Exceptional 98.2% |
| Lebanese | 93.8 /100 | #124 | Exceptional 98.2% |
| Iroquois | 93.7 /100 | #125 | Exceptional 98.2% |
| Menominee | 93.6 /100 | #126 | Exceptional 98.2% |
| Immigrants | Saudi Arabia | 93.4 /100 | #127 | Exceptional 98.2% |
| Immigrants | Serbia | 92.4 /100 | #128 | Exceptional 98.2% |
| Cambodians | 91.4 /100 | #129 | Exceptional 98.2% |
| Immigrants | Croatia | 91.4 /100 | #130 | Exceptional 98.2% |
| Spaniards | 91.1 /100 | #131 | Exceptional 98.2% |
| Seminole | 90.9 /100 | #132 | Exceptional 98.2% |
| Immigrants | Europe | 90.7 /100 | #133 | Exceptional 98.1% |
| Immigrants | Bulgaria | 89.4 /100 | #134 | Excellent 98.1% |
| Immigrants | Hungary | 89.3 /100 | #135 | Excellent 98.1% |
| Immigrants | Kuwait | 88.9 /100 | #136 | Excellent 98.1% |
| Israelis | 88.2 /100 | #137 | Excellent 98.1% |
Demographics Similar to Laotians by Nursery School
In terms of nursery school, the demographic groups most similar to Laotians are Immigrants from Oceania (97.8%, a difference of 0.0%), Immigrants from Northern Africa (97.8%, a difference of 0.010%), Costa Rican (97.8%, a difference of 0.010%), Immigrants from Bahamas (97.8%, a difference of 0.010%), and Moroccan (97.8%, a difference of 0.010%).
| Demographics | Rating | Rank | Nursery School |
| Immigrants | Southern Europe | 17.4 /100 | #204 | Poor 97.9% |
| Immigrants | Chile | 17.3 /100 | #205 | Poor 97.9% |
| Immigrants | Albania | 16.4 /100 | #206 | Poor 97.9% |
| Africans | 15.4 /100 | #207 | Poor 97.9% |
| Immigrants | Northern Africa | 11.7 /100 | #208 | Poor 97.8% |
| Costa Ricans | 11.3 /100 | #209 | Poor 97.8% |
| Immigrants | Oceania | 10.2 /100 | #210 | Poor 97.8% |
| Laotians | 9.8 /100 | #211 | Tragic 97.8% |
| Immigrants | Bahamas | 8.6 /100 | #212 | Tragic 97.8% |
| Moroccans | 8.3 /100 | #213 | Tragic 97.8% |
| South American Indians | 8.0 /100 | #214 | Tragic 97.8% |
| Bahamians | 7.4 /100 | #215 | Tragic 97.8% |
| Uruguayans | 7.1 /100 | #216 | Tragic 97.8% |
| Samoans | 6.3 /100 | #217 | Tragic 97.8% |
| Immigrants | Panama | 5.3 /100 | #218 | Tragic 97.8% |