Venezuelan vs Tongan College, 1 year or more
COMPARE
Venezuelan
Tongan
College, 1 year or more
College, 1 year or more Comparison
Venezuelans
Tongans
61.3%
COLLEGE, 1 YEAR OR MORE
92.1/ 100
METRIC RATING
124th/ 347
METRIC RANK
57.8%
COLLEGE, 1 YEAR OR MORE
11.6/ 100
METRIC RATING
215th/ 347
METRIC RANK
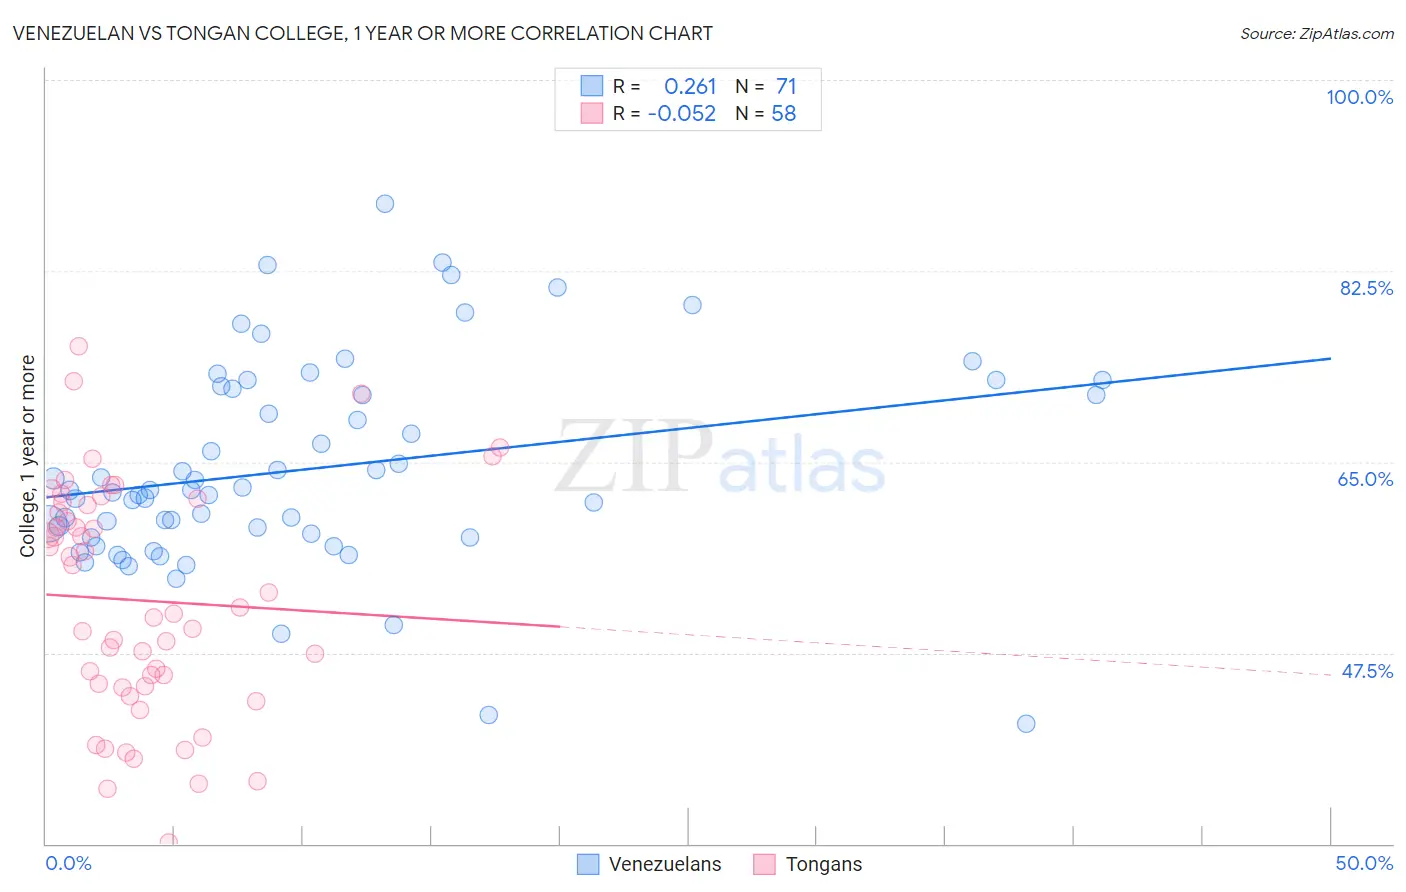
Venezuelan vs Tongan College, 1 year or more Correlation Chart
The statistical analysis conducted on geographies consisting of 306,322,543 people shows a weak positive correlation between the proportion of Venezuelans and percentage of population with at least college, 1 year or more education in the United States with a correlation coefficient (R) of 0.261 and weighted average of 61.3%. Similarly, the statistical analysis conducted on geographies consisting of 102,908,759 people shows a slight negative correlation between the proportion of Tongans and percentage of population with at least college, 1 year or more education in the United States with a correlation coefficient (R) of -0.052 and weighted average of 57.8%, a difference of 6.1%.
College, 1 year or more Correlation Summary
| Measurement | Venezuelan | Tongan |
| Minimum | 41.0% | 30.2% |
| Maximum | 88.6% | 75.6% |
| Range | 47.7% | 45.4% |
| Mean | 64.3% | 52.3% |
| Median | 62.4% | 51.4% |
| Interquartile 25% (IQ1) | 58.1% | 44.5% |
| Interquartile 75% (IQ3) | 71.7% | 61.1% |
| Interquartile Range (IQR) | 13.6% | 16.6% |
| Standard Deviation (Sample) | 9.4% | 10.5% |
| Standard Deviation (Population) | 9.3% | 10.5% |
Similar Demographics by College, 1 year or more
Demographics Similar to Venezuelans by College, 1 year or more
In terms of college, 1 year or more, the demographic groups most similar to Venezuelans are Serbian (61.4%, a difference of 0.030%), Immigrants from Chile (61.4%, a difference of 0.040%), Immigrants from Syria (61.3%, a difference of 0.080%), Immigrants from Jordan (61.4%, a difference of 0.12%), and Alsatian (61.3%, a difference of 0.13%).
| Demographics | Rating | Rank | College, 1 year or more |
| Arabs | 93.9 /100 | #117 | Exceptional 61.6% |
| Immigrants | Brazil | 93.9 /100 | #118 | Exceptional 61.6% |
| Assyrians/Chaldeans/Syriacs | 93.3 /100 | #119 | Exceptional 61.5% |
| Pakistanis | 93.2 /100 | #120 | Exceptional 61.5% |
| Immigrants | Jordan | 92.7 /100 | #121 | Exceptional 61.4% |
| Immigrants | Chile | 92.3 /100 | #122 | Exceptional 61.4% |
| Serbians | 92.2 /100 | #123 | Exceptional 61.4% |
| Venezuelans | 92.1 /100 | #124 | Exceptional 61.3% |
| Immigrants | Syria | 91.6 /100 | #125 | Exceptional 61.3% |
| Alsatians | 91.3 /100 | #126 | Exceptional 61.3% |
| Immigrants | Eastern Africa | 91.1 /100 | #127 | Exceptional 61.2% |
| Immigrants | Italy | 91.1 /100 | #128 | Exceptional 61.2% |
| Ugandans | 90.7 /100 | #129 | Exceptional 61.2% |
| Italians | 89.5 /100 | #130 | Excellent 61.1% |
| Immigrants | Morocco | 89.5 /100 | #131 | Excellent 61.1% |
Demographics Similar to Tongans by College, 1 year or more
In terms of college, 1 year or more, the demographic groups most similar to Tongans are Immigrants from Colombia (57.8%, a difference of 0.0%), Immigrants from Senegal (57.8%, a difference of 0.040%), French Canadian (57.8%, a difference of 0.040%), Immigrants from Peru (57.7%, a difference of 0.13%), and Immigrants from Nigeria (57.9%, a difference of 0.21%).
| Demographics | Rating | Rank | College, 1 year or more |
| Immigrants | Uruguay | 15.2 /100 | #208 | Poor 58.1% |
| Immigrants | Middle Africa | 14.0 /100 | #209 | Poor 58.0% |
| Tsimshian | 13.5 /100 | #210 | Poor 57.9% |
| Immigrants | Nigeria | 13.3 /100 | #211 | Poor 57.9% |
| Immigrants | Senegal | 11.8 /100 | #212 | Poor 57.8% |
| French Canadians | 11.8 /100 | #213 | Poor 57.8% |
| Immigrants | Colombia | 11.6 /100 | #214 | Poor 57.8% |
| Tongans | 11.6 /100 | #215 | Poor 57.8% |
| Immigrants | Peru | 10.6 /100 | #216 | Poor 57.7% |
| Immigrants | Panama | 9.1 /100 | #217 | Tragic 57.6% |
| Native Hawaiians | 9.0 /100 | #218 | Tragic 57.6% |
| Whites/Caucasians | 8.7 /100 | #219 | Tragic 57.6% |
| Immigrants | Costa Rica | 8.0 /100 | #220 | Tragic 57.5% |
| Immigrants | Ghana | 7.7 /100 | #221 | Tragic 57.4% |
| Sub-Saharan Africans | 6.1 /100 | #222 | Tragic 57.3% |