Immigrants from Croatia vs New Zealander Professional Degree
COMPARE
Immigrants from Croatia
New Zealander
Professional Degree
Professional Degree Comparison
Immigrants from Croatia
New Zealanders
5.3%
PROFESSIONAL DEGREE
99.6/ 100
METRIC RATING
84th/ 347
METRIC RANK
6.0%
PROFESSIONAL DEGREE
100.0/ 100
METRIC RATING
41st/ 347
METRIC RANK
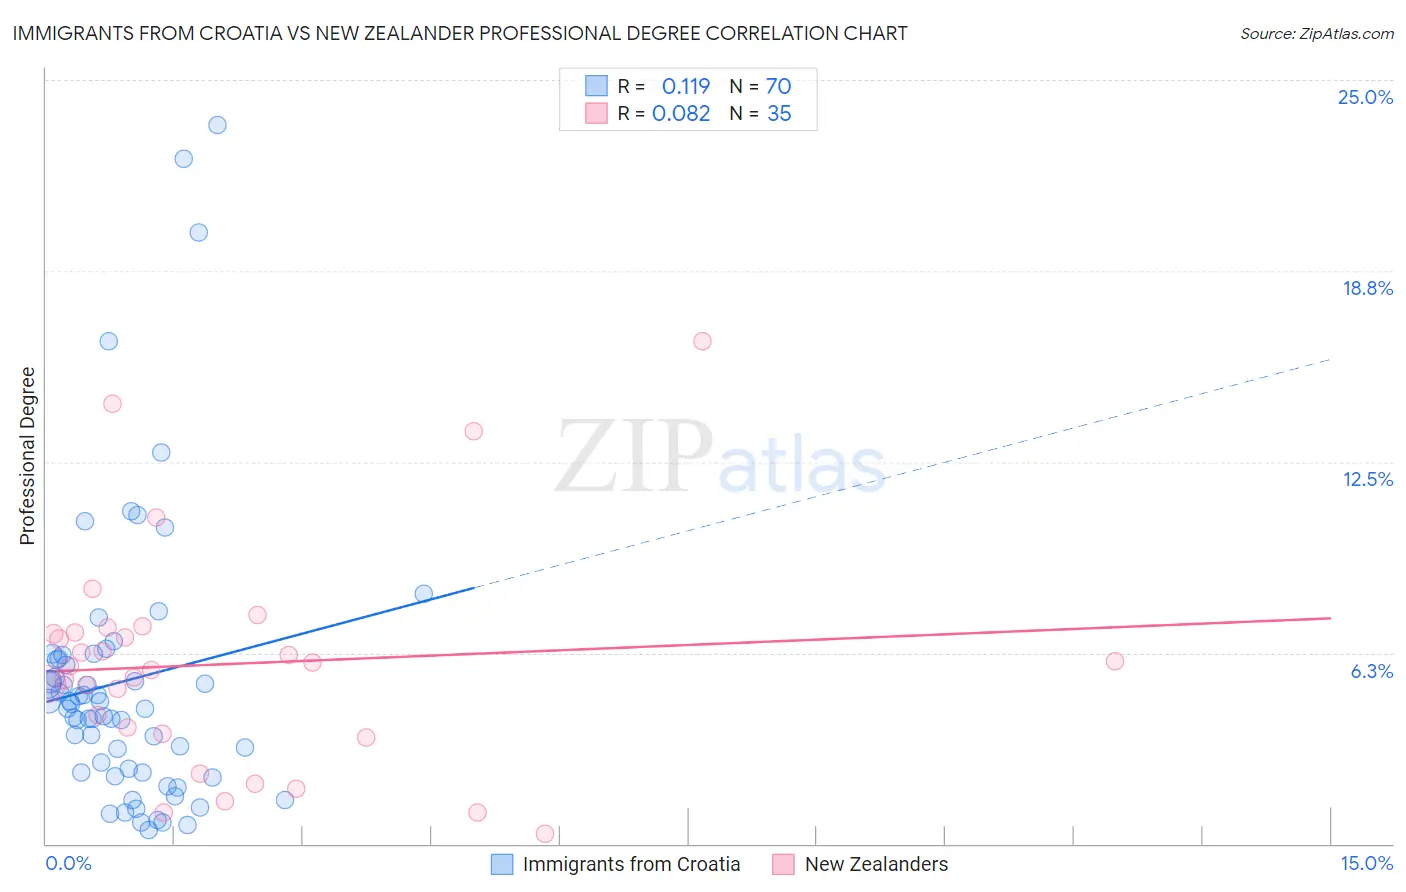
Immigrants from Croatia vs New Zealander Professional Degree Correlation Chart
The statistical analysis conducted on geographies consisting of 132,543,380 people shows a poor positive correlation between the proportion of Immigrants from Croatia and percentage of population with at least professional degree education in the United States with a correlation coefficient (R) of 0.119 and weighted average of 5.3%. Similarly, the statistical analysis conducted on geographies consisting of 106,863,101 people shows a slight positive correlation between the proportion of New Zealanders and percentage of population with at least professional degree education in the United States with a correlation coefficient (R) of 0.082 and weighted average of 6.0%, a difference of 13.0%.
Professional Degree Correlation Summary
| Measurement | Immigrants from Croatia | New Zealander |
| Minimum | 0.47% | 0.31% |
| Maximum | 23.5% | 16.5% |
| Range | 23.1% | 16.1% |
| Mean | 5.3% | 5.9% |
| Median | 4.5% | 5.8% |
| Interquartile 25% (IQ1) | 2.3% | 3.6% |
| Interquartile 75% (IQ3) | 6.1% | 6.9% |
| Interquartile Range (IQR) | 3.7% | 3.3% |
| Standard Deviation (Sample) | 4.7% | 3.6% |
| Standard Deviation (Population) | 4.6% | 3.6% |
Similar Demographics by Professional Degree
Demographics Similar to Immigrants from Croatia by Professional Degree
In terms of professional degree, the demographic groups most similar to Immigrants from Croatia are Carpatho Rusyn (5.3%, a difference of 0.0%), Immigrants from Zimbabwe (5.3%, a difference of 0.020%), Greek (5.3%, a difference of 0.020%), Immigrants from Chile (5.3%, a difference of 0.13%), and Romanian (5.3%, a difference of 0.20%).
| Demographics | Rating | Rank | Professional Degree |
| Immigrants | Ethiopia | 99.7 /100 | #77 | Exceptional 5.3% |
| Armenians | 99.7 /100 | #78 | Exceptional 5.3% |
| Immigrants | North America | 99.7 /100 | #79 | Exceptional 5.3% |
| Immigrants | England | 99.6 /100 | #80 | Exceptional 5.3% |
| Immigrants | Brazil | 99.6 /100 | #81 | Exceptional 5.3% |
| Romanians | 99.6 /100 | #82 | Exceptional 5.3% |
| Carpatho Rusyns | 99.6 /100 | #83 | Exceptional 5.3% |
| Immigrants | Croatia | 99.6 /100 | #84 | Exceptional 5.3% |
| Immigrants | Zimbabwe | 99.6 /100 | #85 | Exceptional 5.3% |
| Greeks | 99.6 /100 | #86 | Exceptional 5.3% |
| Immigrants | Chile | 99.5 /100 | #87 | Exceptional 5.3% |
| Egyptians | 99.5 /100 | #88 | Exceptional 5.3% |
| Chileans | 99.5 /100 | #89 | Exceptional 5.3% |
| Immigrants | Scotland | 99.5 /100 | #90 | Exceptional 5.3% |
| Laotians | 99.5 /100 | #91 | Exceptional 5.2% |
Demographics Similar to New Zealanders by Professional Degree
In terms of professional degree, the demographic groups most similar to New Zealanders are Estonian (6.0%, a difference of 0.010%), Cambodian (6.0%, a difference of 0.18%), Immigrants from Saudi Arabia (5.9%, a difference of 0.33%), Argentinean (5.9%, a difference of 0.49%), and Immigrants from South Africa (6.0%, a difference of 0.66%).
| Demographics | Rating | Rank | Professional Degree |
| Mongolians | 100.0 /100 | #34 | Exceptional 6.1% |
| Immigrants | Korea | 100.0 /100 | #35 | Exceptional 6.1% |
| Immigrants | Russia | 100.0 /100 | #36 | Exceptional 6.0% |
| Immigrants | Austria | 100.0 /100 | #37 | Exceptional 6.0% |
| Immigrants | Norway | 100.0 /100 | #38 | Exceptional 6.0% |
| Immigrants | South Africa | 100.0 /100 | #39 | Exceptional 6.0% |
| Cambodians | 100.0 /100 | #40 | Exceptional 6.0% |
| New Zealanders | 100.0 /100 | #41 | Exceptional 6.0% |
| Estonians | 100.0 /100 | #42 | Exceptional 6.0% |
| Immigrants | Saudi Arabia | 100.0 /100 | #43 | Exceptional 5.9% |
| Argentineans | 100.0 /100 | #44 | Exceptional 5.9% |
| Immigrants | South Central Asia | 100.0 /100 | #45 | Exceptional 5.9% |
| Immigrants | Argentina | 100.0 /100 | #46 | Exceptional 5.9% |
| Australians | 100.0 /100 | #47 | Exceptional 5.9% |
| Paraguayans | 100.0 /100 | #48 | Exceptional 5.9% |