Immigrants from Somalia vs New Zealander Doctorate Degree
COMPARE
Immigrants from Somalia
New Zealander
Doctorate Degree
Doctorate Degree Comparison
Immigrants from Somalia
New Zealanders
1.8%
DOCTORATE DEGREE
25.4/ 100
METRIC RATING
195th/ 347
METRIC RANK
2.5%
DOCTORATE DEGREE
100.0/ 100
METRIC RATING
42nd/ 347
METRIC RANK
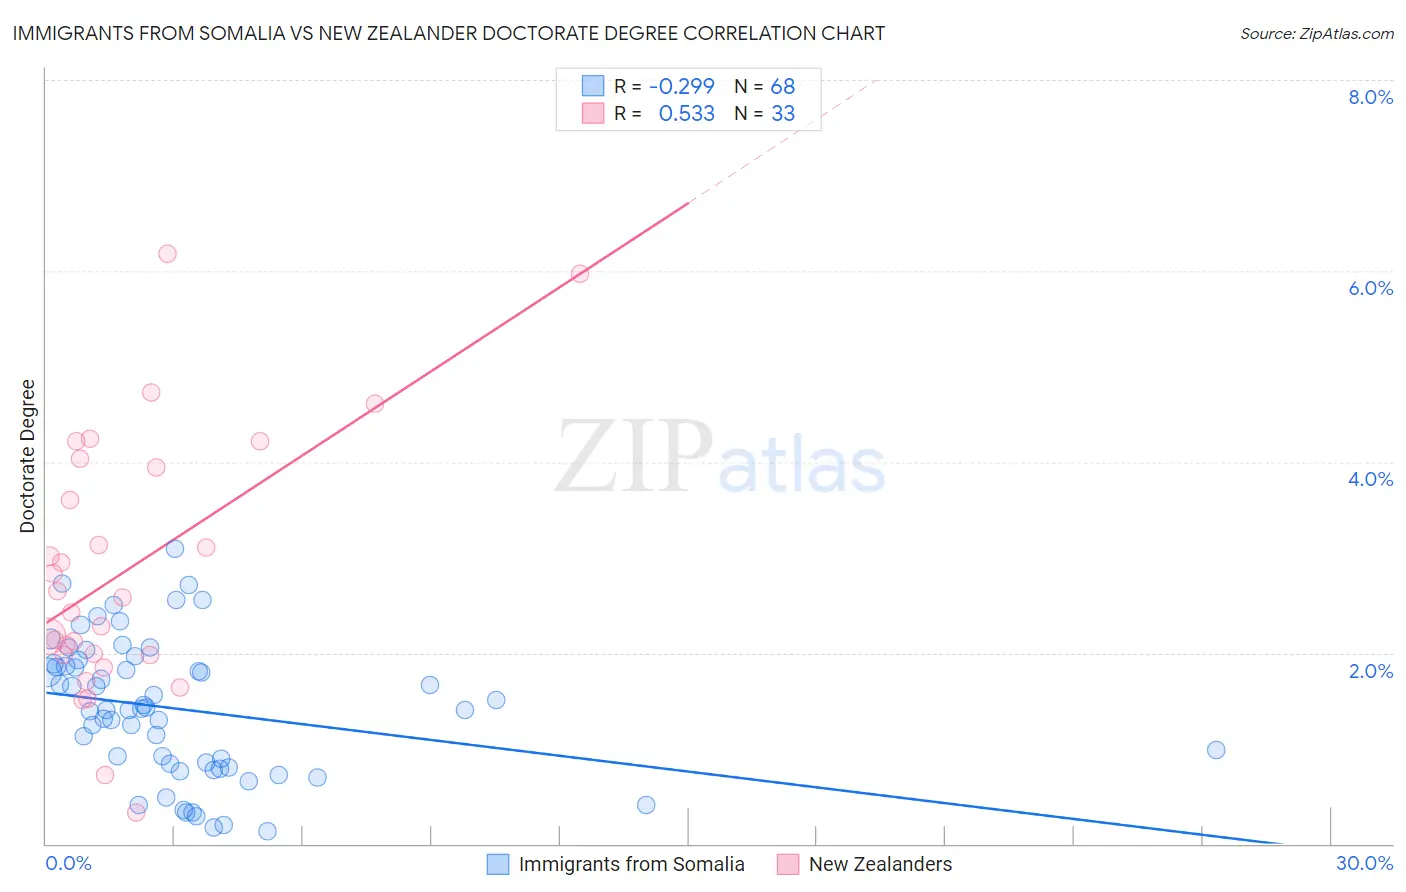
Immigrants from Somalia vs New Zealander Doctorate Degree Correlation Chart
The statistical analysis conducted on geographies consisting of 91,934,011 people shows a weak negative correlation between the proportion of Immigrants from Somalia and percentage of population with at least doctorate degree education in the United States with a correlation coefficient (R) of -0.299 and weighted average of 1.8%. Similarly, the statistical analysis conducted on geographies consisting of 106,690,602 people shows a substantial positive correlation between the proportion of New Zealanders and percentage of population with at least doctorate degree education in the United States with a correlation coefficient (R) of 0.533 and weighted average of 2.5%, a difference of 41.8%.
Doctorate Degree Correlation Summary
| Measurement | Immigrants from Somalia | New Zealander |
| Minimum | 0.13% | 0.33% |
| Maximum | 3.1% | 6.2% |
| Range | 3.0% | 5.9% |
| Mean | 1.4% | 2.9% |
| Median | 1.4% | 2.6% |
| Interquartile 25% (IQ1) | 0.82% | 2.0% |
| Interquartile 75% (IQ3) | 1.9% | 4.0% |
| Interquartile Range (IQR) | 1.1% | 2.0% |
| Standard Deviation (Sample) | 0.72% | 1.4% |
| Standard Deviation (Population) | 0.71% | 1.3% |
Similar Demographics by Doctorate Degree
Demographics Similar to Immigrants from Somalia by Doctorate Degree
In terms of doctorate degree, the demographic groups most similar to Immigrants from Somalia are Subsaharan African (1.8%, a difference of 0.070%), Chinese (1.8%, a difference of 0.070%), Uruguayan (1.8%, a difference of 0.15%), Immigrants from Ghana (1.8%, a difference of 0.16%), and German Russian (1.8%, a difference of 0.33%).
| Demographics | Rating | Rank | Doctorate Degree |
| Germans | 30.5 /100 | #188 | Fair 1.8% |
| French Canadians | 30.2 /100 | #189 | Fair 1.8% |
| Immigrants | Costa Rica | 30.2 /100 | #190 | Fair 1.8% |
| South Americans | 29.5 /100 | #191 | Fair 1.8% |
| Dutch | 27.4 /100 | #192 | Fair 1.8% |
| German Russians | 27.1 /100 | #193 | Fair 1.8% |
| Uruguayans | 26.2 /100 | #194 | Fair 1.8% |
| Immigrants | Somalia | 25.4 /100 | #195 | Fair 1.8% |
| Sub-Saharan Africans | 25.1 /100 | #196 | Fair 1.8% |
| Chinese | 25.1 /100 | #197 | Fair 1.8% |
| Immigrants | Ghana | 24.6 /100 | #198 | Fair 1.8% |
| Immigrants | South America | 23.3 /100 | #199 | Fair 1.8% |
| Whites/Caucasians | 22.8 /100 | #200 | Fair 1.8% |
| Immigrants | Nigeria | 22.4 /100 | #201 | Fair 1.8% |
| Portuguese | 21.4 /100 | #202 | Fair 1.8% |
Demographics Similar to New Zealanders by Doctorate Degree
In terms of doctorate degree, the demographic groups most similar to New Zealanders are Immigrants from Russia (2.5%, a difference of 0.63%), Soviet Union (2.5%, a difference of 0.94%), Estonian (2.5%, a difference of 0.96%), Immigrants from Netherlands (2.5%, a difference of 0.97%), and Immigrants from Ireland (2.5%, a difference of 1.4%).
| Demographics | Rating | Rank | Doctorate Degree |
| Immigrants | Malaysia | 100.0 /100 | #35 | Exceptional 2.6% |
| Immigrants | Spain | 100.0 /100 | #36 | Exceptional 2.6% |
| Immigrants | Kuwait | 100.0 /100 | #37 | Exceptional 2.6% |
| Russians | 100.0 /100 | #38 | Exceptional 2.6% |
| Immigrants | Ireland | 100.0 /100 | #39 | Exceptional 2.5% |
| Estonians | 100.0 /100 | #40 | Exceptional 2.5% |
| Immigrants | Russia | 100.0 /100 | #41 | Exceptional 2.5% |
| New Zealanders | 100.0 /100 | #42 | Exceptional 2.5% |
| Soviet Union | 100.0 /100 | #43 | Exceptional 2.5% |
| Immigrants | Netherlands | 100.0 /100 | #44 | Exceptional 2.5% |
| Immigrants | South Africa | 100.0 /100 | #45 | Exceptional 2.4% |
| Immigrants | Austria | 100.0 /100 | #46 | Exceptional 2.4% |
| Immigrants | Western Europe | 100.0 /100 | #47 | Exceptional 2.4% |
| Asians | 100.0 /100 | #48 | Exceptional 2.4% |
| Immigrants | Asia | 100.0 /100 | #49 | Exceptional 2.4% |