Asian vs Cuban Doctorate Degree
COMPARE
Asian
Cuban
Doctorate Degree
Doctorate Degree Comparison
Asians
Cubans
2.4%
DOCTORATE DEGREE
100.0/ 100
METRIC RATING
48th/ 347
METRIC RANK
1.4%
DOCTORATE DEGREE
0.1/ 100
METRIC RATING
307th/ 347
METRIC RANK
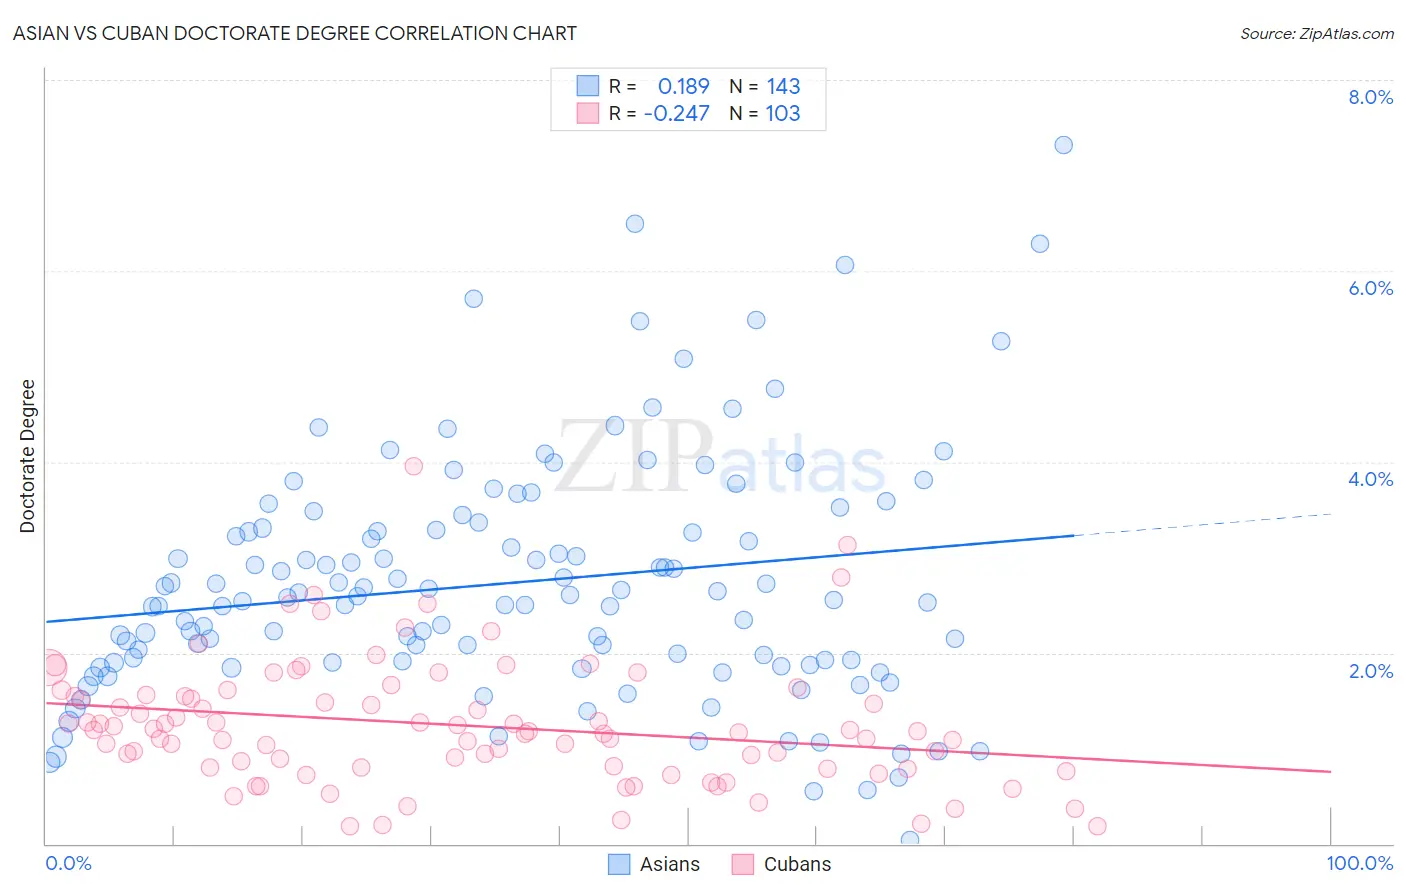
Asian vs Cuban Doctorate Degree Correlation Chart
The statistical analysis conducted on geographies consisting of 534,469,334 people shows a poor positive correlation between the proportion of Asians and percentage of population with at least doctorate degree education in the United States with a correlation coefficient (R) of 0.189 and weighted average of 2.4%. Similarly, the statistical analysis conducted on geographies consisting of 443,089,370 people shows a weak negative correlation between the proportion of Cubans and percentage of population with at least doctorate degree education in the United States with a correlation coefficient (R) of -0.247 and weighted average of 1.4%, a difference of 76.4%.
Doctorate Degree Correlation Summary
| Measurement | Asian | Cuban |
| Minimum | 0.043% | 0.18% |
| Maximum | 7.3% | 4.0% |
| Range | 7.3% | 3.8% |
| Mean | 2.7% | 1.2% |
| Median | 2.6% | 1.2% |
| Interquartile 25% (IQ1) | 1.9% | 0.79% |
| Interquartile 75% (IQ3) | 3.3% | 1.6% |
| Interquartile Range (IQR) | 1.4% | 0.76% |
| Standard Deviation (Sample) | 1.3% | 0.65% |
| Standard Deviation (Population) | 1.3% | 0.65% |
Similar Demographics by Doctorate Degree
Demographics Similar to Asians by Doctorate Degree
In terms of doctorate degree, the demographic groups most similar to Asians are Immigrants from Asia (2.4%, a difference of 0.13%), Immigrants from Western Europe (2.4%, a difference of 0.21%), Immigrants from Austria (2.4%, a difference of 0.44%), Immigrants from South Africa (2.4%, a difference of 0.57%), and Immigrants from Norway (2.4%, a difference of 1.3%).
| Demographics | Rating | Rank | Doctorate Degree |
| Immigrants | Russia | 100.0 /100 | #41 | Exceptional 2.5% |
| New Zealanders | 100.0 /100 | #42 | Exceptional 2.5% |
| Soviet Union | 100.0 /100 | #43 | Exceptional 2.5% |
| Immigrants | Netherlands | 100.0 /100 | #44 | Exceptional 2.5% |
| Immigrants | South Africa | 100.0 /100 | #45 | Exceptional 2.4% |
| Immigrants | Austria | 100.0 /100 | #46 | Exceptional 2.4% |
| Immigrants | Western Europe | 100.0 /100 | #47 | Exceptional 2.4% |
| Asians | 100.0 /100 | #48 | Exceptional 2.4% |
| Immigrants | Asia | 100.0 /100 | #49 | Exceptional 2.4% |
| Immigrants | Norway | 100.0 /100 | #50 | Exceptional 2.4% |
| Australians | 100.0 /100 | #51 | Exceptional 2.4% |
| Bulgarians | 100.0 /100 | #52 | Exceptional 2.4% |
| Immigrants | Latvia | 100.0 /100 | #53 | Exceptional 2.4% |
| Immigrants | Indonesia | 100.0 /100 | #54 | Exceptional 2.4% |
| Bolivians | 100.0 /100 | #55 | Exceptional 2.4% |
Demographics Similar to Cubans by Doctorate Degree
In terms of doctorate degree, the demographic groups most similar to Cubans are Immigrants from Laos (1.4%, a difference of 0.050%), Guyanese (1.4%, a difference of 0.25%), Pennsylvania German (1.4%, a difference of 0.26%), Mexican American Indian (1.4%, a difference of 0.40%), and Immigrants from Dominica (1.4%, a difference of 0.45%).
| Demographics | Rating | Rank | Doctorate Degree |
| Immigrants | Guatemala | 0.1 /100 | #300 | Tragic 1.4% |
| Hondurans | 0.1 /100 | #301 | Tragic 1.4% |
| Shoshone | 0.1 /100 | #302 | Tragic 1.4% |
| Immigrants | Dominica | 0.1 /100 | #303 | Tragic 1.4% |
| Mexican American Indians | 0.1 /100 | #304 | Tragic 1.4% |
| Pennsylvania Germans | 0.1 /100 | #305 | Tragic 1.4% |
| Guyanese | 0.1 /100 | #306 | Tragic 1.4% |
| Cubans | 0.1 /100 | #307 | Tragic 1.4% |
| Immigrants | Laos | 0.1 /100 | #308 | Tragic 1.4% |
| Immigrants | Grenada | 0.1 /100 | #309 | Tragic 1.4% |
| Immigrants | Jamaica | 0.1 /100 | #310 | Tragic 1.4% |
| Immigrants | Honduras | 0.1 /100 | #311 | Tragic 1.4% |
| Immigrants | Nicaragua | 0.1 /100 | #312 | Tragic 1.4% |
| Menominee | 0.1 /100 | #313 | Tragic 1.4% |
| Dominicans | 0.1 /100 | #314 | Tragic 1.4% |