Immigrants from Congo vs British Doctorate Degree
COMPARE
Immigrants from Congo
British
Doctorate Degree
Doctorate Degree Comparison
Immigrants from Congo
British
1.6%
DOCTORATE DEGREE
2.6/ 100
METRIC RATING
238th/ 347
METRIC RANK
2.2%
DOCTORATE DEGREE
99.3/ 100
METRIC RATING
89th/ 347
METRIC RANK
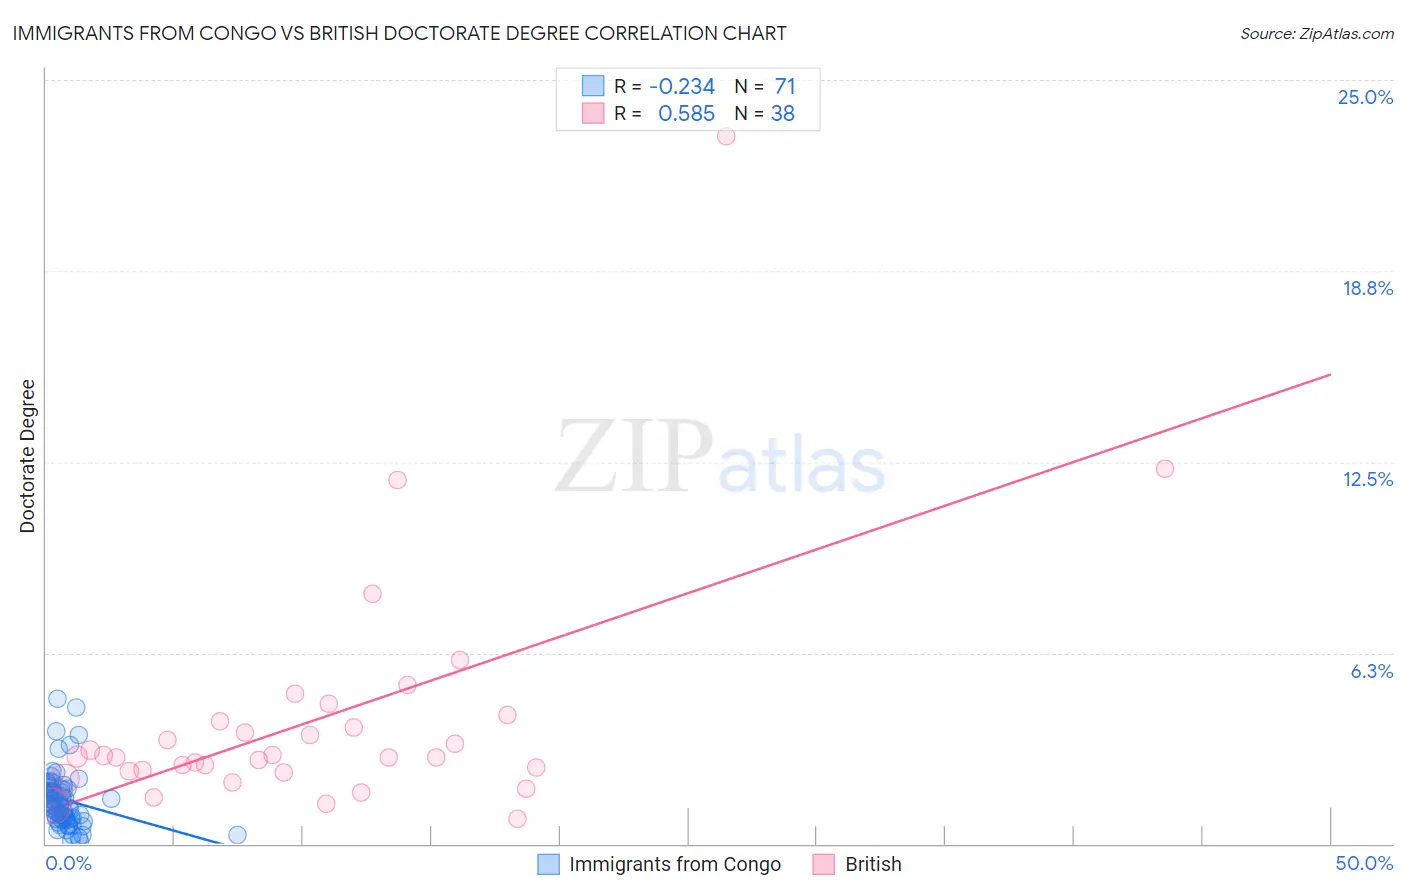
Immigrants from Congo vs British Doctorate Degree Correlation Chart
The statistical analysis conducted on geographies consisting of 91,930,885 people shows a weak negative correlation between the proportion of Immigrants from Congo and percentage of population with at least doctorate degree education in the United States with a correlation coefficient (R) of -0.234 and weighted average of 1.6%. Similarly, the statistical analysis conducted on geographies consisting of 517,011,664 people shows a substantial positive correlation between the proportion of British and percentage of population with at least doctorate degree education in the United States with a correlation coefficient (R) of 0.585 and weighted average of 2.2%, a difference of 36.0%.
Doctorate Degree Correlation Summary
| Measurement | Immigrants from Congo | British |
| Minimum | 0.075% | 0.83% |
| Maximum | 4.8% | 23.1% |
| Range | 4.7% | 22.3% |
| Mean | 1.4% | 4.1% |
| Median | 1.3% | 2.8% |
| Interquartile 25% (IQ1) | 0.80% | 2.4% |
| Interquartile 75% (IQ3) | 1.8% | 4.0% |
| Interquartile Range (IQR) | 1.0% | 1.6% |
| Standard Deviation (Sample) | 0.94% | 4.0% |
| Standard Deviation (Population) | 0.93% | 4.0% |
Similar Demographics by Doctorate Degree
Demographics Similar to Immigrants from Congo by Doctorate Degree
In terms of doctorate degree, the demographic groups most similar to Immigrants from Congo are West Indian (1.6%, a difference of 0.10%), Iroquois (1.6%, a difference of 0.20%), Immigrants from Panama (1.6%, a difference of 0.29%), Indonesian (1.6%, a difference of 0.39%), and Cheyenne (1.6%, a difference of 0.48%).
| Demographics | Rating | Rank | Doctorate Degree |
| Immigrants | North Macedonia | 3.9 /100 | #231 | Tragic 1.6% |
| Guamanians/Chamorros | 3.3 /100 | #232 | Tragic 1.6% |
| Barbadians | 3.3 /100 | #233 | Tragic 1.6% |
| Hopi | 3.2 /100 | #234 | Tragic 1.6% |
| Cree | 3.0 /100 | #235 | Tragic 1.6% |
| Indonesians | 2.8 /100 | #236 | Tragic 1.6% |
| Iroquois | 2.7 /100 | #237 | Tragic 1.6% |
| Immigrants | Congo | 2.6 /100 | #238 | Tragic 1.6% |
| West Indians | 2.5 /100 | #239 | Tragic 1.6% |
| Immigrants | Panama | 2.4 /100 | #240 | Tragic 1.6% |
| Cheyenne | 2.3 /100 | #241 | Tragic 1.6% |
| Ottawa | 2.2 /100 | #242 | Tragic 1.6% |
| Native Hawaiians | 2.1 /100 | #243 | Tragic 1.6% |
| French American Indians | 2.0 /100 | #244 | Tragic 1.6% |
| Delaware | 1.9 /100 | #245 | Tragic 1.6% |
Demographics Similar to British by Doctorate Degree
In terms of doctorate degree, the demographic groups most similar to British are Immigrants from Scotland (2.2%, a difference of 0.020%), Immigrants from Nepal (2.2%, a difference of 0.44%), Immigrants from Sudan (2.2%, a difference of 0.49%), Chilean (2.2%, a difference of 0.75%), and Immigrants from Zimbabwe (2.2%, a difference of 0.80%).
| Demographics | Rating | Rank | Doctorate Degree |
| Immigrants | Uganda | 99.6 /100 | #82 | Exceptional 2.2% |
| Immigrants | Lithuania | 99.6 /100 | #83 | Exceptional 2.2% |
| Immigrants | England | 99.6 /100 | #84 | Exceptional 2.2% |
| Immigrants | Brazil | 99.6 /100 | #85 | Exceptional 2.2% |
| Egyptians | 99.4 /100 | #86 | Exceptional 2.2% |
| Immigrants | Zimbabwe | 99.4 /100 | #87 | Exceptional 2.2% |
| Immigrants | Nepal | 99.3 /100 | #88 | Exceptional 2.2% |
| British | 99.3 /100 | #89 | Exceptional 2.2% |
| Immigrants | Scotland | 99.2 /100 | #90 | Exceptional 2.2% |
| Immigrants | Sudan | 99.1 /100 | #91 | Exceptional 2.2% |
| Chileans | 99.1 /100 | #92 | Exceptional 2.2% |
| Alsatians | 99.0 /100 | #93 | Exceptional 2.1% |
| Greeks | 98.8 /100 | #94 | Exceptional 2.1% |
| Immigrants | Romania | 98.7 /100 | #95 | Exceptional 2.1% |
| Immigrants | Northern Africa | 98.4 /100 | #96 | Exceptional 2.1% |