Immigrants from Dominica vs Russian Doctorate Degree
COMPARE
Immigrants from Dominica
Russian
Doctorate Degree
Doctorate Degree Comparison
Immigrants from Dominica
Russians
1.4%
DOCTORATE DEGREE
0.1/ 100
METRIC RATING
303rd/ 347
METRIC RANK
2.6%
DOCTORATE DEGREE
100.0/ 100
METRIC RATING
38th/ 347
METRIC RANK
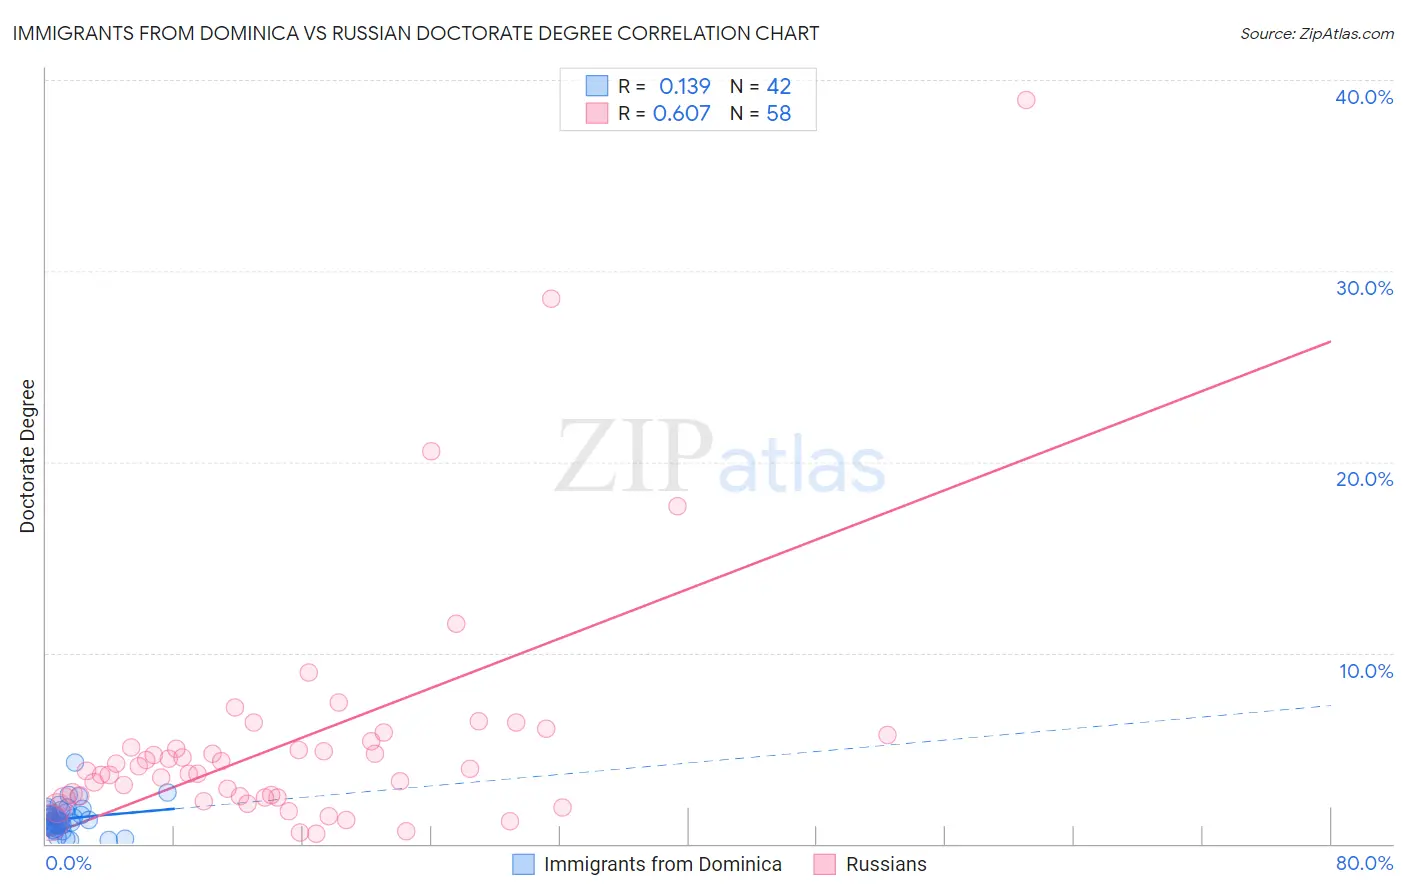
Immigrants from Dominica vs Russian Doctorate Degree Correlation Chart
The statistical analysis conducted on geographies consisting of 83,662,569 people shows a poor positive correlation between the proportion of Immigrants from Dominica and percentage of population with at least doctorate degree education in the United States with a correlation coefficient (R) of 0.139 and weighted average of 1.4%. Similarly, the statistical analysis conducted on geographies consisting of 501,018,326 people shows a significant positive correlation between the proportion of Russians and percentage of population with at least doctorate degree education in the United States with a correlation coefficient (R) of 0.607 and weighted average of 2.6%, a difference of 84.5%.
Doctorate Degree Correlation Summary
| Measurement | Immigrants from Dominica | Russian |
| Minimum | 0.18% | 0.50% |
| Maximum | 4.2% | 39.0% |
| Range | 4.1% | 38.5% |
| Mean | 1.3% | 5.4% |
| Median | 1.2% | 3.9% |
| Interquartile 25% (IQ1) | 0.94% | 2.4% |
| Interquartile 75% (IQ3) | 1.6% | 5.4% |
| Interquartile Range (IQR) | 0.67% | 2.9% |
| Standard Deviation (Sample) | 0.76% | 6.5% |
| Standard Deviation (Population) | 0.75% | 6.4% |
Similar Demographics by Doctorate Degree
Demographics Similar to Immigrants from Dominica by Doctorate Degree
In terms of doctorate degree, the demographic groups most similar to Immigrants from Dominica are Shoshone (1.4%, a difference of 0.030%), Mexican American Indian (1.4%, a difference of 0.060%), Pennsylvania German (1.4%, a difference of 0.19%), Guyanese (1.4%, a difference of 0.20%), and Honduran (1.4%, a difference of 0.36%).
| Demographics | Rating | Rank | Doctorate Degree |
| Immigrants | Ecuador | 0.2 /100 | #296 | Tragic 1.4% |
| Tsimshian | 0.2 /100 | #297 | Tragic 1.4% |
| Puerto Ricans | 0.1 /100 | #298 | Tragic 1.4% |
| Belizeans | 0.1 /100 | #299 | Tragic 1.4% |
| Immigrants | Guatemala | 0.1 /100 | #300 | Tragic 1.4% |
| Hondurans | 0.1 /100 | #301 | Tragic 1.4% |
| Shoshone | 0.1 /100 | #302 | Tragic 1.4% |
| Immigrants | Dominica | 0.1 /100 | #303 | Tragic 1.4% |
| Mexican American Indians | 0.1 /100 | #304 | Tragic 1.4% |
| Pennsylvania Germans | 0.1 /100 | #305 | Tragic 1.4% |
| Guyanese | 0.1 /100 | #306 | Tragic 1.4% |
| Cubans | 0.1 /100 | #307 | Tragic 1.4% |
| Immigrants | Laos | 0.1 /100 | #308 | Tragic 1.4% |
| Immigrants | Grenada | 0.1 /100 | #309 | Tragic 1.4% |
| Immigrants | Jamaica | 0.1 /100 | #310 | Tragic 1.4% |
Demographics Similar to Russians by Doctorate Degree
In terms of doctorate degree, the demographic groups most similar to Russians are Immigrants from Kuwait (2.6%, a difference of 0.15%), Immigrants from Spain (2.6%, a difference of 0.42%), Immigrants from Malaysia (2.6%, a difference of 0.48%), Immigrants from Ireland (2.5%, a difference of 0.49%), and Cypriot (2.6%, a difference of 0.53%).
| Demographics | Rating | Rank | Doctorate Degree |
| Latvians | 100.0 /100 | #31 | Exceptional 2.6% |
| Immigrants | Northern Europe | 100.0 /100 | #32 | Exceptional 2.6% |
| Cambodians | 100.0 /100 | #33 | Exceptional 2.6% |
| Cypriots | 100.0 /100 | #34 | Exceptional 2.6% |
| Immigrants | Malaysia | 100.0 /100 | #35 | Exceptional 2.6% |
| Immigrants | Spain | 100.0 /100 | #36 | Exceptional 2.6% |
| Immigrants | Kuwait | 100.0 /100 | #37 | Exceptional 2.6% |
| Russians | 100.0 /100 | #38 | Exceptional 2.6% |
| Immigrants | Ireland | 100.0 /100 | #39 | Exceptional 2.5% |
| Estonians | 100.0 /100 | #40 | Exceptional 2.5% |
| Immigrants | Russia | 100.0 /100 | #41 | Exceptional 2.5% |
| New Zealanders | 100.0 /100 | #42 | Exceptional 2.5% |
| Soviet Union | 100.0 /100 | #43 | Exceptional 2.5% |
| Immigrants | Netherlands | 100.0 /100 | #44 | Exceptional 2.5% |
| Immigrants | South Africa | 100.0 /100 | #45 | Exceptional 2.4% |