Immigrants from Congo vs Croatian Doctorate Degree
COMPARE
Immigrants from Congo
Croatian
Doctorate Degree
Doctorate Degree Comparison
Immigrants from Congo
Croatians
1.6%
DOCTORATE DEGREE
2.6/ 100
METRIC RATING
238th/ 347
METRIC RANK
2.0%
DOCTORATE DEGREE
94.0/ 100
METRIC RATING
123rd/ 347
METRIC RANK
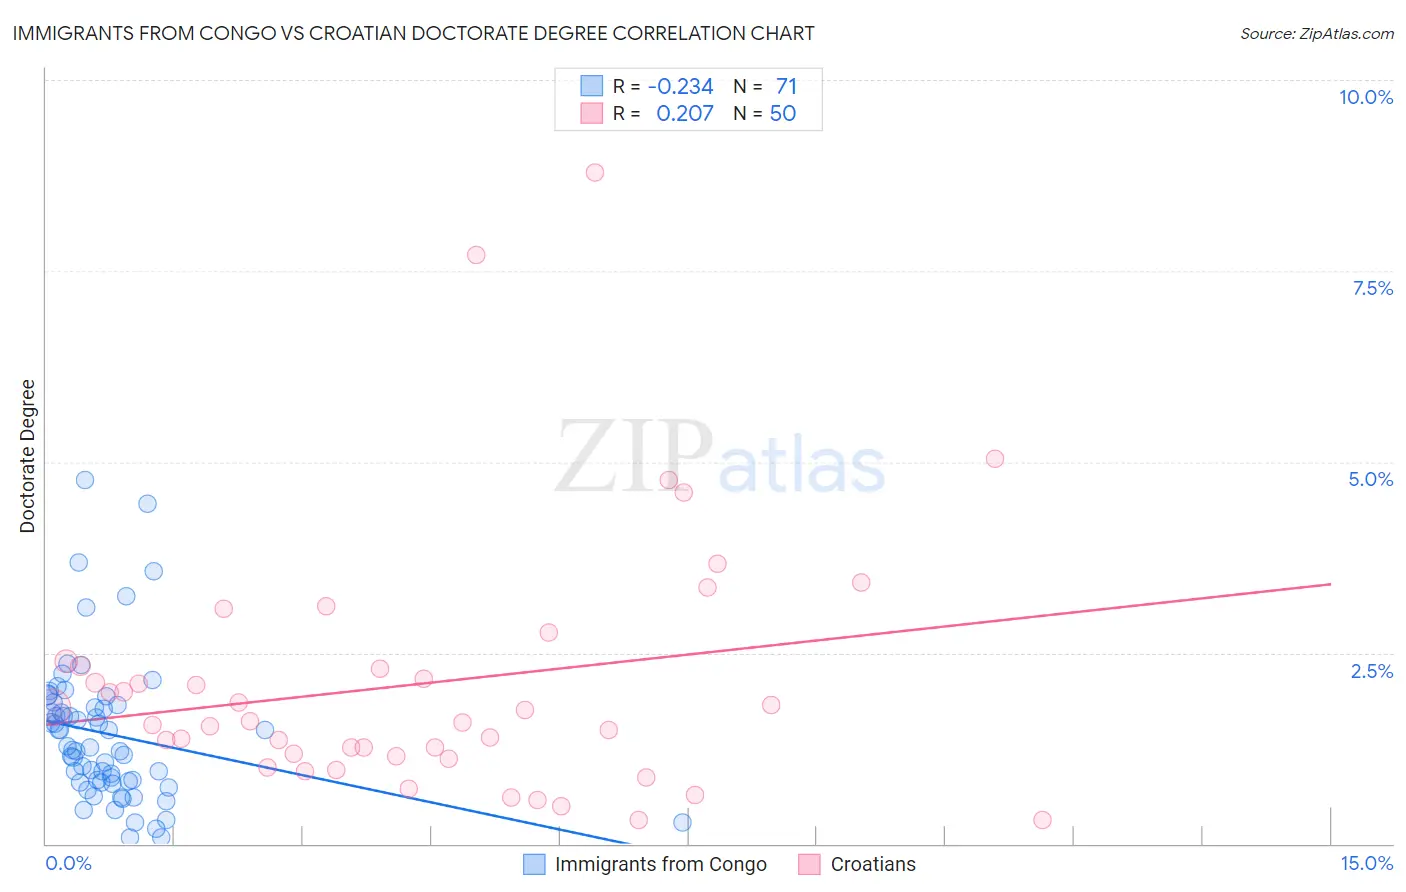
Immigrants from Congo vs Croatian Doctorate Degree Correlation Chart
The statistical analysis conducted on geographies consisting of 91,930,885 people shows a weak negative correlation between the proportion of Immigrants from Congo and percentage of population with at least doctorate degree education in the United States with a correlation coefficient (R) of -0.234 and weighted average of 1.6%. Similarly, the statistical analysis conducted on geographies consisting of 372,078,203 people shows a weak positive correlation between the proportion of Croatians and percentage of population with at least doctorate degree education in the United States with a correlation coefficient (R) of 0.207 and weighted average of 2.0%, a difference of 27.0%.
Doctorate Degree Correlation Summary
| Measurement | Immigrants from Congo | Croatian |
| Minimum | 0.075% | 0.31% |
| Maximum | 4.8% | 8.8% |
| Range | 4.7% | 8.5% |
| Mean | 1.4% | 2.1% |
| Median | 1.3% | 1.6% |
| Interquartile 25% (IQ1) | 0.80% | 1.1% |
| Interquartile 75% (IQ3) | 1.8% | 2.3% |
| Interquartile Range (IQR) | 1.0% | 1.2% |
| Standard Deviation (Sample) | 0.94% | 1.7% |
| Standard Deviation (Population) | 0.93% | 1.7% |
Similar Demographics by Doctorate Degree
Demographics Similar to Immigrants from Congo by Doctorate Degree
In terms of doctorate degree, the demographic groups most similar to Immigrants from Congo are West Indian (1.6%, a difference of 0.10%), Iroquois (1.6%, a difference of 0.20%), Immigrants from Panama (1.6%, a difference of 0.29%), Indonesian (1.6%, a difference of 0.39%), and Cheyenne (1.6%, a difference of 0.48%).
| Demographics | Rating | Rank | Doctorate Degree |
| Immigrants | North Macedonia | 3.9 /100 | #231 | Tragic 1.6% |
| Guamanians/Chamorros | 3.3 /100 | #232 | Tragic 1.6% |
| Barbadians | 3.3 /100 | #233 | Tragic 1.6% |
| Hopi | 3.2 /100 | #234 | Tragic 1.6% |
| Cree | 3.0 /100 | #235 | Tragic 1.6% |
| Indonesians | 2.8 /100 | #236 | Tragic 1.6% |
| Iroquois | 2.7 /100 | #237 | Tragic 1.6% |
| Immigrants | Congo | 2.6 /100 | #238 | Tragic 1.6% |
| West Indians | 2.5 /100 | #239 | Tragic 1.6% |
| Immigrants | Panama | 2.4 /100 | #240 | Tragic 1.6% |
| Cheyenne | 2.3 /100 | #241 | Tragic 1.6% |
| Ottawa | 2.2 /100 | #242 | Tragic 1.6% |
| Native Hawaiians | 2.1 /100 | #243 | Tragic 1.6% |
| French American Indians | 2.0 /100 | #244 | Tragic 1.6% |
| Delaware | 1.9 /100 | #245 | Tragic 1.6% |
Demographics Similar to Croatians by Doctorate Degree
In terms of doctorate degree, the demographic groups most similar to Croatians are Immigrants from Southern Europe (2.0%, a difference of 0.46%), Ute (2.0%, a difference of 0.47%), Immigrants from Jordan (2.0%, a difference of 0.48%), Moroccan (2.0%, a difference of 0.58%), and Immigrants from Morocco (2.0%, a difference of 0.96%).
| Demographics | Rating | Rank | Doctorate Degree |
| Maltese | 96.2 /100 | #116 | Exceptional 2.1% |
| Lebanese | 96.0 /100 | #117 | Exceptional 2.1% |
| Icelanders | 96.0 /100 | #118 | Exceptional 2.1% |
| Pakistanis | 95.8 /100 | #119 | Exceptional 2.0% |
| Immigrants | Morocco | 95.5 /100 | #120 | Exceptional 2.0% |
| Immigrants | Jordan | 94.8 /100 | #121 | Exceptional 2.0% |
| Immigrants | Southern Europe | 94.7 /100 | #122 | Exceptional 2.0% |
| Croatians | 94.0 /100 | #123 | Exceptional 2.0% |
| Ute | 93.2 /100 | #124 | Exceptional 2.0% |
| Moroccans | 93.0 /100 | #125 | Exceptional 2.0% |
| Jordanians | 92.1 /100 | #126 | Exceptional 2.0% |
| Palestinians | 92.0 /100 | #127 | Exceptional 2.0% |
| Immigrants | Zaire | 91.1 /100 | #128 | Exceptional 2.0% |
| Canadians | 90.6 /100 | #129 | Exceptional 2.0% |
| Immigrants | Ukraine | 90.5 /100 | #130 | Exceptional 2.0% |