Immigrants from Ukraine vs Russian Doctorate Degree
COMPARE
Immigrants from Ukraine
Russian
Doctorate Degree
Doctorate Degree Comparison
Immigrants from Ukraine
Russians
2.0%
DOCTORATE DEGREE
90.5/ 100
METRIC RATING
130th/ 347
METRIC RANK
2.6%
DOCTORATE DEGREE
100.0/ 100
METRIC RATING
38th/ 347
METRIC RANK
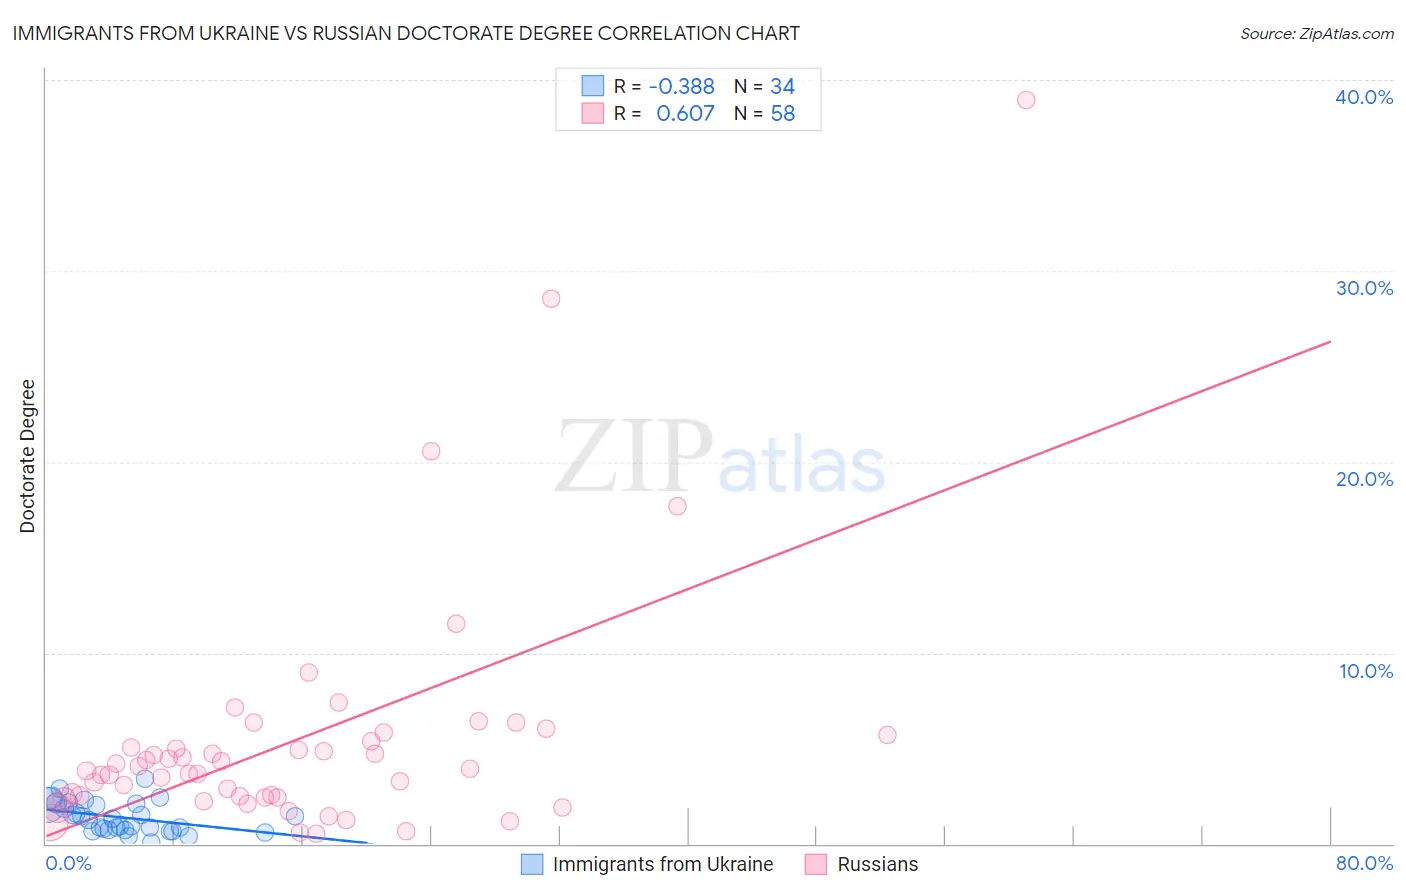
Immigrants from Ukraine vs Russian Doctorate Degree Correlation Chart
The statistical analysis conducted on geographies consisting of 288,420,787 people shows a mild negative correlation between the proportion of Immigrants from Ukraine and percentage of population with at least doctorate degree education in the United States with a correlation coefficient (R) of -0.388 and weighted average of 2.0%. Similarly, the statistical analysis conducted on geographies consisting of 501,018,326 people shows a significant positive correlation between the proportion of Russians and percentage of population with at least doctorate degree education in the United States with a correlation coefficient (R) of 0.607 and weighted average of 2.6%, a difference of 28.1%.
Doctorate Degree Correlation Summary
| Measurement | Immigrants from Ukraine | Russian |
| Minimum | 0.095% | 0.50% |
| Maximum | 3.4% | 39.0% |
| Range | 3.3% | 38.5% |
| Mean | 1.4% | 5.4% |
| Median | 1.3% | 3.9% |
| Interquartile 25% (IQ1) | 0.75% | 2.4% |
| Interquartile 75% (IQ3) | 2.1% | 5.4% |
| Interquartile Range (IQR) | 1.3% | 2.9% |
| Standard Deviation (Sample) | 0.79% | 6.5% |
| Standard Deviation (Population) | 0.78% | 6.4% |
Similar Demographics by Doctorate Degree
Demographics Similar to Immigrants from Ukraine by Doctorate Degree
In terms of doctorate degree, the demographic groups most similar to Immigrants from Ukraine are Canadian (2.0%, a difference of 0.010%), Immigrants from Sierra Leone (2.0%, a difference of 0.14%), Immigrants from Zaire (2.0%, a difference of 0.22%), Scottish (2.0%, a difference of 0.41%), and Immigrants from Uzbekistan (2.0%, a difference of 0.46%).
| Demographics | Rating | Rank | Doctorate Degree |
| Croatians | 94.0 /100 | #123 | Exceptional 2.0% |
| Ute | 93.2 /100 | #124 | Exceptional 2.0% |
| Moroccans | 93.0 /100 | #125 | Exceptional 2.0% |
| Jordanians | 92.1 /100 | #126 | Exceptional 2.0% |
| Palestinians | 92.0 /100 | #127 | Exceptional 2.0% |
| Immigrants | Zaire | 91.1 /100 | #128 | Exceptional 2.0% |
| Canadians | 90.6 /100 | #129 | Exceptional 2.0% |
| Immigrants | Ukraine | 90.5 /100 | #130 | Exceptional 2.0% |
| Immigrants | Sierra Leone | 90.2 /100 | #131 | Exceptional 2.0% |
| Scottish | 89.4 /100 | #132 | Excellent 2.0% |
| Immigrants | Uzbekistan | 89.3 /100 | #133 | Excellent 2.0% |
| Immigrants | Cameroon | 88.9 /100 | #134 | Excellent 2.0% |
| Serbians | 88.7 /100 | #135 | Excellent 2.0% |
| Swedes | 88.3 /100 | #136 | Excellent 2.0% |
| South American Indians | 88.3 /100 | #137 | Excellent 2.0% |
Demographics Similar to Russians by Doctorate Degree
In terms of doctorate degree, the demographic groups most similar to Russians are Immigrants from Kuwait (2.6%, a difference of 0.15%), Immigrants from Spain (2.6%, a difference of 0.42%), Immigrants from Malaysia (2.6%, a difference of 0.48%), Immigrants from Ireland (2.5%, a difference of 0.49%), and Cypriot (2.6%, a difference of 0.53%).
| Demographics | Rating | Rank | Doctorate Degree |
| Latvians | 100.0 /100 | #31 | Exceptional 2.6% |
| Immigrants | Northern Europe | 100.0 /100 | #32 | Exceptional 2.6% |
| Cambodians | 100.0 /100 | #33 | Exceptional 2.6% |
| Cypriots | 100.0 /100 | #34 | Exceptional 2.6% |
| Immigrants | Malaysia | 100.0 /100 | #35 | Exceptional 2.6% |
| Immigrants | Spain | 100.0 /100 | #36 | Exceptional 2.6% |
| Immigrants | Kuwait | 100.0 /100 | #37 | Exceptional 2.6% |
| Russians | 100.0 /100 | #38 | Exceptional 2.6% |
| Immigrants | Ireland | 100.0 /100 | #39 | Exceptional 2.5% |
| Estonians | 100.0 /100 | #40 | Exceptional 2.5% |
| Immigrants | Russia | 100.0 /100 | #41 | Exceptional 2.5% |
| New Zealanders | 100.0 /100 | #42 | Exceptional 2.5% |
| Soviet Union | 100.0 /100 | #43 | Exceptional 2.5% |
| Immigrants | Netherlands | 100.0 /100 | #44 | Exceptional 2.5% |
| Immigrants | South Africa | 100.0 /100 | #45 | Exceptional 2.4% |