Immigrants from Congo vs African 3rd Grade
COMPARE
Immigrants from Congo
African
3rd Grade
3rd Grade Comparison
Immigrants from Congo
Africans
97.3%
3RD GRADE
0.6/ 100
METRIC RATING
256th/ 347
METRIC RANK
97.6%
3RD GRADE
14.5/ 100
METRIC RATING
205th/ 347
METRIC RANK
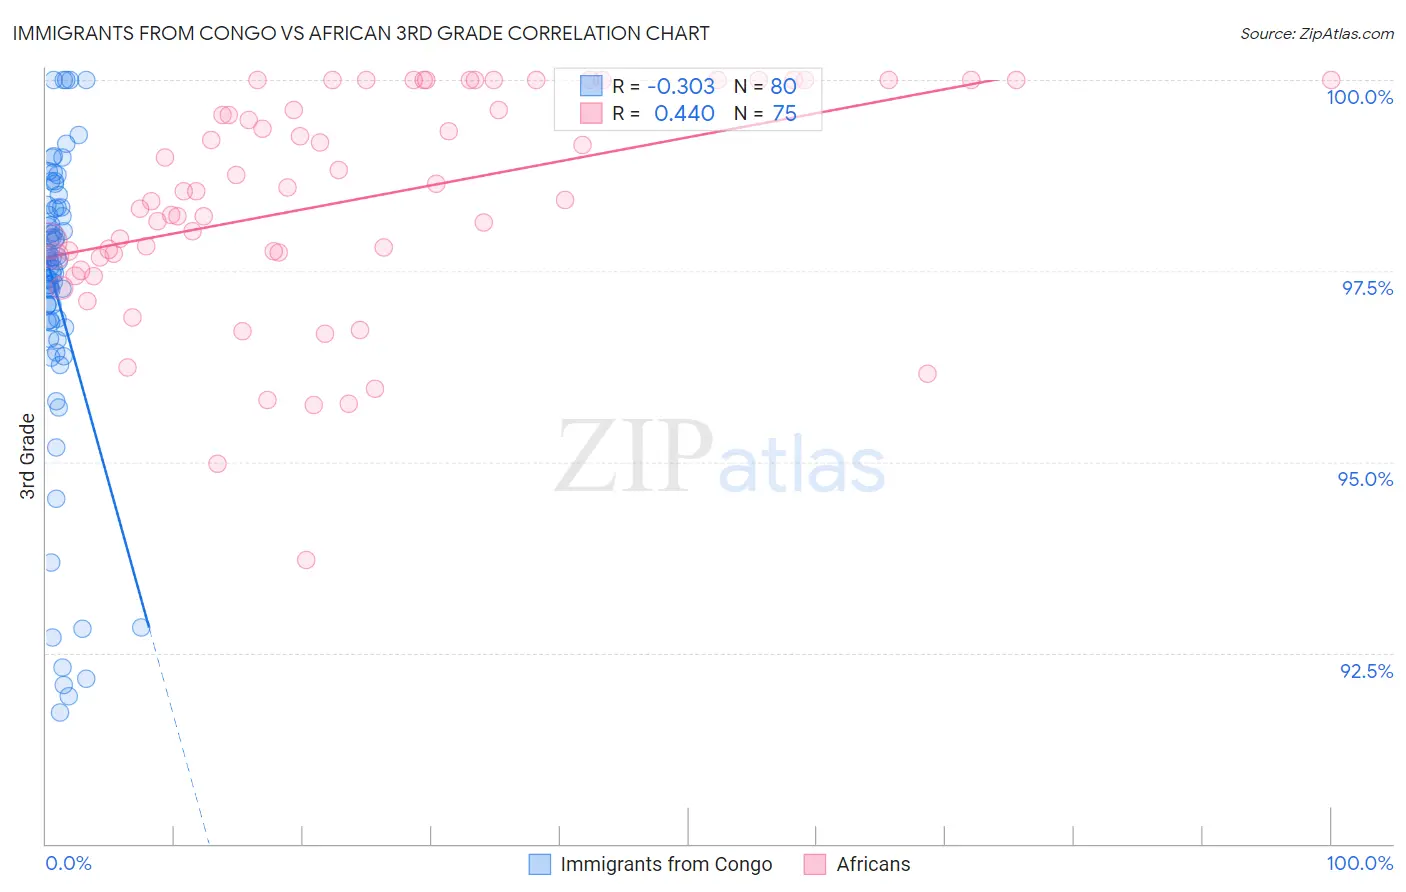
Immigrants from Congo vs African 3rd Grade Correlation Chart
The statistical analysis conducted on geographies consisting of 92,124,753 people shows a mild negative correlation between the proportion of Immigrants from Congo and percentage of population with at least 3rd grade education in the United States with a correlation coefficient (R) of -0.303 and weighted average of 97.3%. Similarly, the statistical analysis conducted on geographies consisting of 470,094,148 people shows a moderate positive correlation between the proportion of Africans and percentage of population with at least 3rd grade education in the United States with a correlation coefficient (R) of 0.440 and weighted average of 97.6%, a difference of 0.29%.
3rd Grade Correlation Summary
| Measurement | Immigrants from Congo | African |
| Minimum | 91.7% | 93.7% |
| Maximum | 100.0% | 100.0% |
| Range | 8.3% | 6.3% |
| Mean | 97.2% | 98.4% |
| Median | 97.6% | 98.5% |
| Interquartile 25% (IQ1) | 96.8% | 97.7% |
| Interquartile 75% (IQ3) | 98.3% | 100.0% |
| Interquartile Range (IQR) | 1.5% | 2.3% |
| Standard Deviation (Sample) | 2.0% | 1.4% |
| Standard Deviation (Population) | 2.0% | 1.4% |
Similar Demographics by 3rd Grade
Demographics Similar to Immigrants from Congo by 3rd Grade
In terms of 3rd grade, the demographic groups most similar to Immigrants from Congo are Bolivian (97.3%, a difference of 0.0%), Immigrants from Colombia (97.3%, a difference of 0.010%), Jamaican (97.4%, a difference of 0.020%), Immigrants from Liberia (97.3%, a difference of 0.020%), and Armenian (97.3%, a difference of 0.020%).
| Demographics | Rating | Rank | 3rd Grade |
| South Americans | 0.9 /100 | #249 | Tragic 97.4% |
| Immigrants | Middle Africa | 0.9 /100 | #250 | Tragic 97.4% |
| Immigrants | Asia | 0.8 /100 | #251 | Tragic 97.4% |
| Peruvians | 0.8 /100 | #252 | Tragic 97.4% |
| Immigrants | Africa | 0.8 /100 | #253 | Tragic 97.4% |
| Jamaicans | 0.7 /100 | #254 | Tragic 97.4% |
| Bolivians | 0.6 /100 | #255 | Tragic 97.3% |
| Immigrants | Congo | 0.6 /100 | #256 | Tragic 97.3% |
| Immigrants | Colombia | 0.5 /100 | #257 | Tragic 97.3% |
| Immigrants | Liberia | 0.5 /100 | #258 | Tragic 97.3% |
| Armenians | 0.4 /100 | #259 | Tragic 97.3% |
| Immigrants | Ethiopia | 0.4 /100 | #260 | Tragic 97.3% |
| Immigrants | South America | 0.4 /100 | #261 | Tragic 97.3% |
| Immigrants | Sierra Leone | 0.4 /100 | #262 | Tragic 97.3% |
| Taiwanese | 0.3 /100 | #263 | Tragic 97.3% |
Demographics Similar to Africans by 3rd Grade
In terms of 3rd grade, the demographic groups most similar to Africans are Paiute (97.6%, a difference of 0.010%), Immigrants from Chile (97.6%, a difference of 0.010%), Immigrants from Northern Africa (97.6%, a difference of 0.010%), Tohono O'odham (97.6%, a difference of 0.010%), and Immigrants from Southern Europe (97.6%, a difference of 0.020%).
| Demographics | Rating | Rank | 3rd Grade |
| Guamanians/Chamorros | 23.6 /100 | #198 | Fair 97.7% |
| Immigrants | Ukraine | 22.7 /100 | #199 | Fair 97.7% |
| Immigrants | Albania | 22.6 /100 | #200 | Fair 97.7% |
| Immigrants | Lebanon | 21.7 /100 | #201 | Fair 97.7% |
| Immigrants | Southern Europe | 17.7 /100 | #202 | Poor 97.6% |
| Paiute | 16.7 /100 | #203 | Poor 97.6% |
| Immigrants | Chile | 16.5 /100 | #204 | Poor 97.6% |
| Africans | 14.5 /100 | #205 | Poor 97.6% |
| Immigrants | Northern Africa | 13.0 /100 | #206 | Poor 97.6% |
| Tohono O'odham | 12.5 /100 | #207 | Poor 97.6% |
| Immigrants | Zaire | 11.9 /100 | #208 | Poor 97.6% |
| Costa Ricans | 9.6 /100 | #209 | Tragic 97.6% |
| Immigrants | Oceania | 9.5 /100 | #210 | Tragic 97.6% |
| Laotians | 9.4 /100 | #211 | Tragic 97.6% |
| Immigrants | Bahamas | 8.5 /100 | #212 | Tragic 97.6% |