Immigrants from Congo vs Turkish 3rd Grade
COMPARE
Immigrants from Congo
Turkish
3rd Grade
3rd Grade Comparison
Immigrants from Congo
Turks
97.3%
3RD GRADE
0.6/ 100
METRIC RATING
256th/ 347
METRIC RANK
98.1%
3RD GRADE
97.6/ 100
METRIC RATING
104th/ 347
METRIC RANK
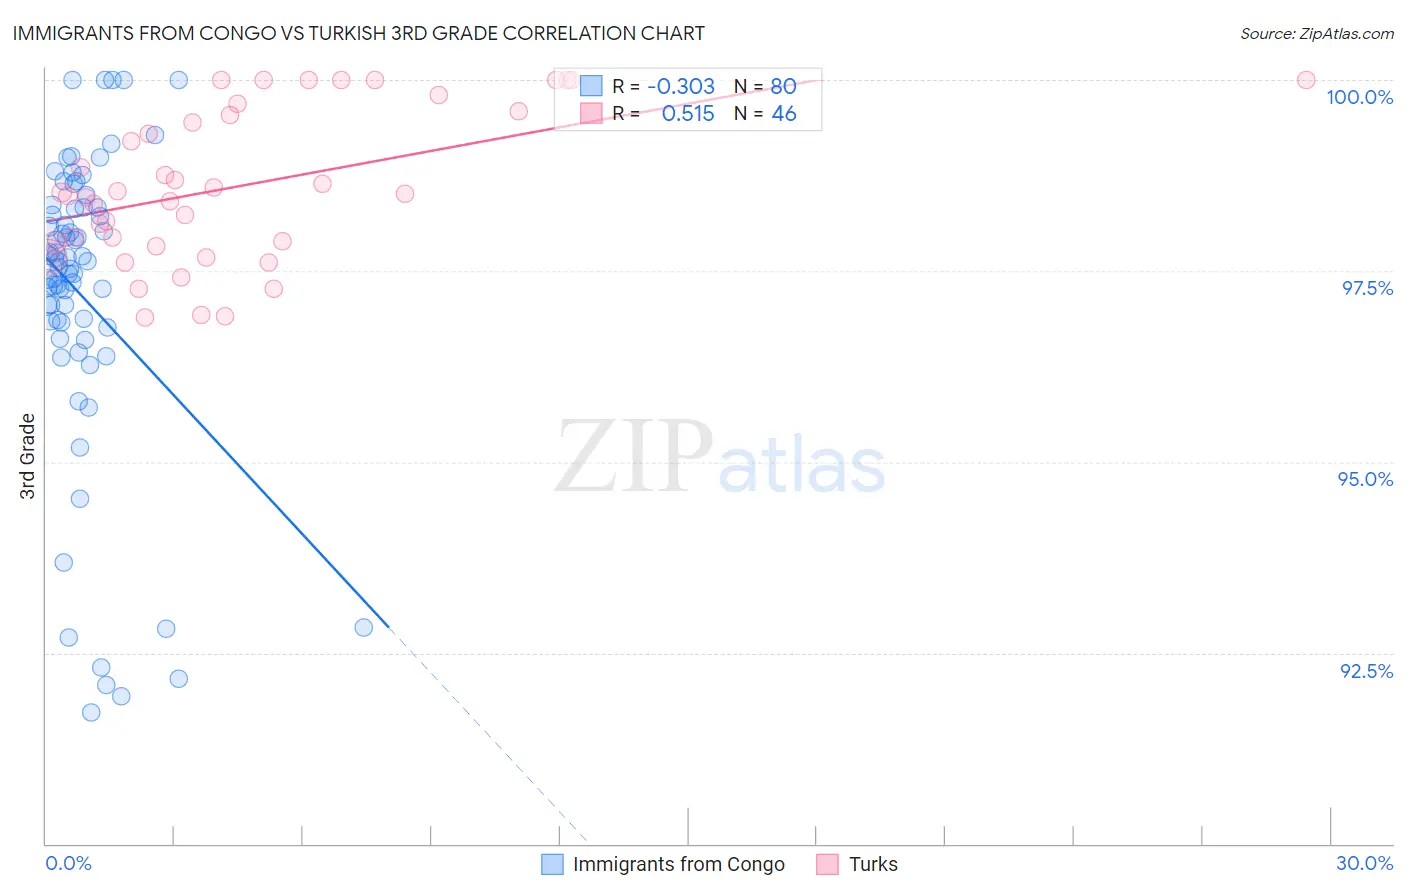
Immigrants from Congo vs Turkish 3rd Grade Correlation Chart
The statistical analysis conducted on geographies consisting of 92,124,753 people shows a mild negative correlation between the proportion of Immigrants from Congo and percentage of population with at least 3rd grade education in the United States with a correlation coefficient (R) of -0.303 and weighted average of 97.3%. Similarly, the statistical analysis conducted on geographies consisting of 271,858,657 people shows a substantial positive correlation between the proportion of Turks and percentage of population with at least 3rd grade education in the United States with a correlation coefficient (R) of 0.515 and weighted average of 98.1%, a difference of 0.76%.
3rd Grade Correlation Summary
| Measurement | Immigrants from Congo | Turkish |
| Minimum | 91.7% | 96.9% |
| Maximum | 100.0% | 100.0% |
| Range | 8.3% | 3.1% |
| Mean | 97.2% | 98.6% |
| Median | 97.6% | 98.5% |
| Interquartile 25% (IQ1) | 96.8% | 97.9% |
| Interquartile 75% (IQ3) | 98.3% | 99.6% |
| Interquartile Range (IQR) | 1.5% | 1.7% |
| Standard Deviation (Sample) | 2.0% | 0.99% |
| Standard Deviation (Population) | 2.0% | 0.98% |
Similar Demographics by 3rd Grade
Demographics Similar to Immigrants from Congo by 3rd Grade
In terms of 3rd grade, the demographic groups most similar to Immigrants from Congo are Bolivian (97.3%, a difference of 0.0%), Immigrants from Colombia (97.3%, a difference of 0.010%), Jamaican (97.4%, a difference of 0.020%), Immigrants from Liberia (97.3%, a difference of 0.020%), and Armenian (97.3%, a difference of 0.020%).
| Demographics | Rating | Rank | 3rd Grade |
| South Americans | 0.9 /100 | #249 | Tragic 97.4% |
| Immigrants | Middle Africa | 0.9 /100 | #250 | Tragic 97.4% |
| Immigrants | Asia | 0.8 /100 | #251 | Tragic 97.4% |
| Peruvians | 0.8 /100 | #252 | Tragic 97.4% |
| Immigrants | Africa | 0.8 /100 | #253 | Tragic 97.4% |
| Jamaicans | 0.7 /100 | #254 | Tragic 97.4% |
| Bolivians | 0.6 /100 | #255 | Tragic 97.3% |
| Immigrants | Congo | 0.6 /100 | #256 | Tragic 97.3% |
| Immigrants | Colombia | 0.5 /100 | #257 | Tragic 97.3% |
| Immigrants | Liberia | 0.5 /100 | #258 | Tragic 97.3% |
| Armenians | 0.4 /100 | #259 | Tragic 97.3% |
| Immigrants | Ethiopia | 0.4 /100 | #260 | Tragic 97.3% |
| Immigrants | South America | 0.4 /100 | #261 | Tragic 97.3% |
| Immigrants | Sierra Leone | 0.4 /100 | #262 | Tragic 97.3% |
| Taiwanese | 0.3 /100 | #263 | Tragic 97.3% |
Demographics Similar to Turks by 3rd Grade
In terms of 3rd grade, the demographic groups most similar to Turks are Yugoslavian (98.1%, a difference of 0.0%), Romanian (98.1%, a difference of 0.010%), Cree (98.1%, a difference of 0.010%), Puget Sound Salish (98.1%, a difference of 0.010%), and Nonimmigrants (98.1%, a difference of 0.010%).
| Demographics | Rating | Rank | 3rd Grade |
| South Africans | 98.2 /100 | #97 | Exceptional 98.1% |
| Choctaw | 98.0 /100 | #98 | Exceptional 98.1% |
| Romanians | 98.0 /100 | #99 | Exceptional 98.1% |
| Cree | 97.9 /100 | #100 | Exceptional 98.1% |
| Puget Sound Salish | 97.9 /100 | #101 | Exceptional 98.1% |
| Immigrants | Nonimmigrants | 97.8 /100 | #102 | Exceptional 98.1% |
| Yugoslavians | 97.7 /100 | #103 | Exceptional 98.1% |
| Turks | 97.6 /100 | #104 | Exceptional 98.1% |
| German Russians | 97.2 /100 | #105 | Exceptional 98.1% |
| Bhutanese | 97.2 /100 | #106 | Exceptional 98.1% |
| Immigrants | Czechoslovakia | 97.0 /100 | #107 | Exceptional 98.0% |
| Immigrants | Singapore | 96.7 /100 | #108 | Exceptional 98.0% |
| Pima | 96.7 /100 | #109 | Exceptional 98.0% |
| Immigrants | Switzerland | 96.6 /100 | #110 | Exceptional 98.0% |
| Basques | 96.5 /100 | #111 | Exceptional 98.0% |